
A Very Tough Quarter for Markets
No question about it—it was a very tough quarter for stock and bond markets and everyone who invests in them. The benchmark S&P 500 fell 16.1% in the quarter, bringing its decline from peak to the 20% drop that arbitrarily defines a bear market. In the face of rising interest rates, US bonds fell another 4.7% in the quarter and are now down 10.4% year-to-date, their worst start in over fifty years. The combination of stocks and bonds both tumbling has made 2022 more painful than typical bear markets, where bonds usually provide a better portfolio cushion.
As unpleasant as this year has been, it is not entirely a bolt from the blue. More realistically, it is a natural reaction to the extraordinary times that preceded it. From the early pandemic low in February 2020 through the end of 2021, the S&P 500 index climbed a stunning 113%, or roughly the equivalent of ten years’ worth of average historical returns in 22 months. The combination of pandemic, government stimulus, and lockdowns led to manic levels of risk appetite for everything from blue chips to bitcoin. A sobering up simply required a catalyst, and that turned out to be inflation.
Resurgent Inflation
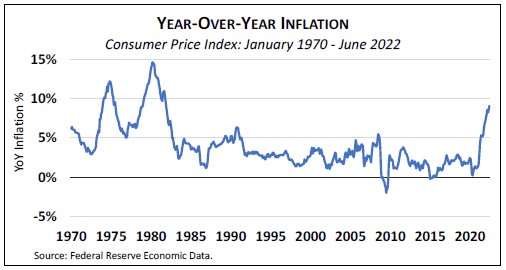
Resurgent inflation is the proximate cause of both stock and bond markets’ swoon this year. After ranging between 0% and 4% for the past thirty years, the Consumer Price Index clocked a 9.1% jump in the twelve months ended June 30. High energy and food prices, exacerbated by the war in Ukraine, are significant contributors, as are consumer catch-up spending and a still tight labor market coming out of the pandemic. The inflation spike triggered a row of market dominoes.
First, the Federal Reserve is aggressively raising short-term interest rates, seeking to tamp down demand and moderate further price hikes. Interest rates on all bond maturities are way above where they began the year. Short-term rates (for example, the 3-month US T-bill), which are most directly affected by Fed policy, jumped from a microscopic 0.06% at the beginning of the year to 1.72% on June 30.
Meanwhile, the benchmark 10-year Treasury yield nearly doubled from 1.52% at year-end to 2.98%. When market interest rates rise, the price of existing bonds must fall to keep their yields competitive with yields on new bonds.
Second, most see rising odds of economic recession in the next year. Higher interest rates dampen growth across the economy, and spiking prices for staple items like gasoline and groceries leave less in the household budget for other spending.
Finally, recession brings lower corporate earnings, while higher interest rates make bonds more competitive with stocks. These are double body blows for the stock market.
Perils of Anchoring
Seeing our portfolio values shrink is unpleasant, even if only on paper. It is human nature to mentally anchor our assets to their maximum historical price, whether that’s the highest value your home reached on Zillow or the biggest number shown on a monthly brokerage statement. It’s easy to think, “if only I’d sold at that high water mark, I’d be better off now.”
Perhaps true, but consider this: we only know a high water mark with the benefit of hindsight. And it is impossible for everyone to sell (at a high water mark or any other time) because for every seller there must be a buyer. In other words, selling at what you think is a peak assumes you’ve figured out something the rest of the market has not—a tempting line of thinking that’s generally hazardous to your financial well-being.
Selling last December (Anchor 1 in the accompanying chart) would have entailed substantial tax liability for most investors, never to be regained. As bad, it would leave you sitting in cash wondering when to get back in. Market bottoms, like tops, are only known with hindsight; the bottom often is reached when pessimism seems to be running highest. In our experience, investors who bail out amid a bear market rarely re-enter at a level below their earlier sale price.
Consolation and Perspective
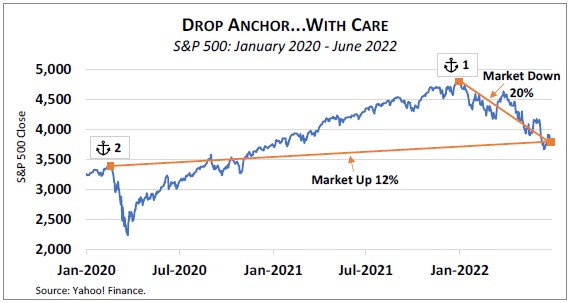
One way to combat regret after a market decline is simply to relocate your anchor. For example, if instead of comparing your assets today to their value at year-end 2021, look to February 19, 2020 (Anchor 2 in the chart), at that time also an all-time high for the S&P 500. Since then, the US stock market is up nearly 12%. Considering that the period included a pandemic, a land war in Europe, and unprecedented political turmoil, 12% could be viewed as a surprisingly good outcome.
Many rightly worry that recession is coming soon or perhaps already here. But from a market perspective, that news is already baked into today’s prices and probably explains much of the recent decline. No one has a crystal ball to foretell where the market will go next, but the odds still favor buying (or holding) stocks after significant market declines.
Looking at post-World War II data, following a 20% decline like we’ve had this year, the S&P 500 finished higher at the end of the subsequent 12-month period about 64% of the time—less than the 79% of calendar years that were positive, but still almost 2-in-3 odds of coming out ahead. Three years out, the market ended higher 90% of the time.1 Consumer sentiment recently reached record lows, thanks to high inflation, but that has often been an indicator of better stock market performance ahead.
Bottom line: in stormy seas, it’s usually best to take a Dramamine and lash yourself to the mast rather than jumping overboard.