Note: This post is an excerpt from Gould Asset Management’s Economic and Market Review for the Third Quarter of 2026. The excerpt is posted here for the benefit of our blog subscribers.
US Economy Holds Steady as Hiring Stalls
The US economy grew at an annualized rate of 2.2% in the second quarter of 2026, easing slightly from a revised 2.5% in the first quarter. Consumers drove the result, with spending accelerating to an annualized 3.8% pace after a sluggish start to the year, while business investment also contributed. Growth would have been even stronger without a jump in imports, much of it computer chips bound for AI infrastructure (imports are subtracted from GDP).
Consumer spending accelerated in August, but households dipped into savings to pay for it. Inflation adjusted spending jumped 0.6% in the month, outpacing income and pushing the savings rate to its lowest level since 2022.
Hiring slowed sharply through the quarter. Payroll gains averaged roughly 50,000 per month, ending with just 29,000 in September after downward revisions to the prior two months. The unemployment rate ticked up to 4.2% but has stayed within a narrow range since March, consistent with the low-hire, low-fire pattern of the past year.
Manufacturing expanded for a ninth consecutive month, its longest run since 2022. The ISM Manufacturing PMI held at a solid 54.5 in September after peaking in July at its highest level in four years. Cost pressures returned, however. The prices index jumped to 77.9, nearly back to where it stood at the start of the Iran war, as tariffs, steel, aluminum, and energy pushed input costs higher.
Warsh Makes His Move as the Fed Hikes Rates
The Federal Reserve raised the federal funds rate by 25 basis points to 3.75%–4.00% at its September meeting, its first increase since 2023. The unanimous decision followed a July meeting in which the Fed held steady but three regional bank presidents dissented in favor of a hike, an early sign that support for tighter monetary policy was building.
Fed Chair Warsh made clear that bringing down inflation is now the Fed’s top priority. The September statement dropped earlier language attributing elevated inflation to energy supply shocks, a sign that officials increasingly see price pressures as broad-based rather than temporary. Warsh again declined to submit his own projection and offered little guidance on the timing of future moves.
The Fed’s latest forecast points to more tightening ahead. Officials raised their 2026 growth forecast to 2.3% from 2.2%, lowered expected year-end unemployment to 4.1%, and nudged core inflation up to 3.4%. Most participants expect at least one more 0.25% rate hike by year-end.
Today’s stock market looks expensive by historical standards. By expensive, we are not talking about the price of stocks, but rather their value—how much we pay for a dollar of corporate earnings, or profits. That measure is called the price-to-earnings (P/E) ratio.
Divide Microsoft’s stock price of $510 by its earnings-per-share of $18 and you get a P/E ratio of 28. Do this for every stock and you can calculate the whole market’s P/E ratio. The accompanying chart shows that today’s market P/E is near its all-time high reached in 2000.
Today’s stock market: Fairly priced, or in a bubble?
There are two main schools of thought on why stocks might look expensive right now. The “efficient market hypothesis” (EMH) argues that prices fairly reflect all information available in the moment. If P/E ratios are historically high, EMH says there must be a good reason. As an example, today’s high P/E ratios might reflect a consensus that AI will accelerate corporate profit growth by increasing efficiency or creating whole new categories of economic activity. The expectation of increased future earnings would justify a higher P/E than before. Bolstering the case for EMH is the lightning speed with which information now moves around the globe and is digested by markets.
The second school focuses on the “animal spirits” that often dominate investor behavior. British economist John Maynard Keynes coined that term to describe how mass psychology periodically drives markets sharply above or below any reasonable measure of their true value. Bouts of widespread euphoria can lead to bubbles in markets for stocks, real estate, and other assets. A storied example: At the peak of the Dutch tulip bulb craze of the 1600s, a single bulb reportedly fetched ten times the annual wage of a skilled craftsman. Likewise, extreme pessimism can color investors’ perceptions. After a decade of high inflation and poor stock market returns, a famous 1979 BusinessWeek cover declared the “death of equities.” Three years later, stocks turned sharply higher, a trend they’ve maintained for most of the past 44 years.
What should a stock market investor do?
If you subscribe to the EMH school, the long-term investor should not change course in response to today’s expensive market. Though the market looks expensive, it’s priced fairly and should deliver a return in line with its risk. So, instead of worrying about whether stocks are overpriced or a bargain (since EMH says they are neither), investors should keep their focus on asset allocation, making sure their portfolio is well diversified and properly reflects their tolerance for risk.
And if today’s prices reflect animal spirits more than logic? Market history is awash in bubbles. If you are over 40, you likely remember the dot-com mania of the late 1990s, when investor rapture over the world-changing potential of the internet pushed the tech-heavy Nasdaq index skyward by about 600% over a 5-year period. The internet did indeed change the world, but investors wildly overestimated its impact on corporate profits. The Nasdaq peaked in March 2000 and then plunged nearly 80% over the next 19 months, giving back almost all its gains of the late 1990s. It was not until 2015 that the index recaptured its 2000 high point.
Today’s AI boom shares characteristics with the dot-com bubble, with companies (and their investors) committing trillions of dollars to AI infrastructure in a race with highly uncertain returns. There are important differences between the two periods, as well. The public companies spending the largest amounts on AI are mostly established and solidly profitable businesses, which was not the case in the dot-com era. Will future earnings justify today’s lofty stock prices? We’ll only know in hindsight.
An investor who is convinced that prices are out of whack due to animal spirits might be tempted to try to time the market. This path is littered with pitfalls.
First, even if you know you’re in a bubble, you still have no idea how much bigger the bubble will get and how long it will take to peak. Suppose a crystal ball tells you that a 46% market drop will begin within five years. What do you do? If the market continues to barrel upward and peaks in three years at 86% above today’s level—about what the US stock market has gained over the last three calendar years—a 46% drop will just bring the market back to today’s level. (The math: (100+86) x (100%-46%) ≈ 100.) Selling today will have gained very little; in fact, after capital gains taxes, your portfolio might be well below its starting position.
Several additional factors argue for staying the course even if you think investor emotions are distorting market prices. No one knows the timing or magnitude of the next bear market. We can’t identify an extended downturn until the market is long past its peak. And most won’t believe the market has reached its low point until a new uptrend is well established. The sobering upshot: it’s highly unlikely we’ll sell at the top or buy at the bottom.
The Surprising Conclusion…and One Caveat
So, it turns out that if the simple objective is making money, it doesn’t matter much whether or not the market is priced correctly. If it’s priced correctly (per EMH), then there’s nothing to be gained from trading. And if it’s in a bubble, arguably the hazards of market timing more than offset any potential gains.
That said, there is still one argument in favor of reducing stock exposure in an overpriced market, and it has to do with risk. The most severe bear markets tend to be those that follow the biggest runups. If you’re convinced we’re in a bubble, trimming your stock allocation might help you sleep better at night, knowing that your portfolio will decline less when the bubble eventually pops. There is great value in a good night’s rest.
Donald Gould is chairman and chief investment officer of Gould Asset Management of Claremont.Don is a recurring guest columnist for the Courier, providing his unique insights and observations on matters of money, investing, and personal finance.
I am very pleased to announce that effective September 1, 2026, Gould partner and senior portfolio manager Johnny DeBiase will become President of Gould Asset Management. As President, Johnny will oversee the company’s day-to-day business activities.
I will continue to serve as Chief Investment Officer, overseeing investment policy. I will also take on the newly created Chairman role, providing strategic direction and leading communications with clients and the outside community.
Johnny DeBiase joined Gould in 2012 and became a partner in 2016. Working alongside partners Tom Carr, Scott Smith, Derek Baldwin, and the whole Gould team, he has been a key contributor to the company’s growth from six to fifteen people and from under $400 million in assets under management to more than $1.1 billion.
Please join me in congratulating Johnny DeBiase on his appointment as President!
Note: This post is an excerpt from Gould Asset Management’s Economic and Market Review for the Second Quarter of 2026. The excerpt is posted here for the benefit of our blog subscribers.
Stocks Rally in Q2 as Technology Leads Rebound
Global stock markets rebounded sharply in Q2. Investors reacted favorably to an interim US-Iran agreement aimed at ending the conflict and reopening the Strait of Hormuz, leading to lower oil prices. Renewed enthusiasm for artificial intelligence and strong corporate earnings helped investors look past lingering concerns over inflation and interest rates.
US large-cap stocks, represented by the S&P 500 Index, surged 15.2% in Q2, lifting year-to-date returns to 10.2%. The rally more than offset a difficult first quarter. Roughly 85% of S&P 500 companies beat earnings expectations.
Technology led all US sectors in Q2, rocketing 43.5% and pushing its year-to-date gain to 32.7%, as chipmakers and other AI infrastructure companies benefited from rising earnings expectations, strong demand for high-end semiconductors, and continued datacenter investment. Industrials also performed well, gaining 14.9% in Q2 and 20.2% year-to-date, supported by demand tied to AI infrastructure, electrical equipment, defense, and energy investment. Utilities were the weakest-performing sector, declining 0.5%, as defensive areas of the market fell somewhat out of favor
Tax-exempt municipal bonds recorded a strong quarter, returning 2.5% as the market rebounded from a sharp March loss. On a tax-equivalent basis, municipal bond yields reached very attractive levels relative to Treasurys early in Q2, supporting strong investor demand.
Looking ahead, the bond market is likely to remain focused on whether the US economy can sustain the strength it showed during the Iran conflict and whether inflation will begin to moderate. Investors will also be closely watching the early months of new Fed Chair Kevin Warsh's tenure. His suggestion that Federal Reserve officials should communicate less frequently could leave markets with fewer signals about the future path of monetary policy, contributing to greater volatility in fixed income markets.
REITs Rally as Q1 Alternatives Leaders Retreat
Alternatives performance was mixed in Q2, with real estate investment trusts (REITs) posting strong gains while gold, energy stocks, and commodities declined. The sharp retreat in oil prices reversed many of the trends that had driven alternatives higher in Q1, as markets responded favorably to an interim US-Iran agreement and the partial resumption of shipping through the Strait of Hormuz. Despite the quarterly pullback, energy and commodities remain solidly positive for the year.
Gold fell 12.6% in Q2, a sharp reversal from the record highs reached earlier in the year, leaving the precious metal down 6.5% year-to-date. Several of the factors that had supported gold began working against it, including softer demand from gold ETF investors, a stronger US dollar late in the quarter, higher US Treasury yields, and a more hawkish Fed outlook.
Your monthly account statements from the custodian show the “market value” of each investment, which add up to your portfolio value. What do those numbers actually mean?
Suppose you own 100 shares of Microsoft (symbol: MSFT). At the close of the New York Stock Exchange, on June 30, 2026, at 4 pm Eastern Daylight Time, MSFT’s price was $373.02 per share. Your June statement will say you owned Microsoft stock worth $37,302. In fact, what it really says is that if you had sold your 100 shares at that same price, you would have received $37,302.
At any point in time, however, most investors are holders, not sellers. For holders, today’s price may be unimportant, just in the same way your home’s price on Zillow, though fun to check, is irrelevant if you don’t intend to sell soon. For the long-term investor, the market price of MSFT is an unhelpful distraction. It causes us to focus too much on what we might be able to sell for right now and not enough on what the investment might do for us over the time we plan to hold it.[1] But how else can a long-term investor value an investment in stock?
The answer starts with a reminder that “shares” represent ownership of a share—a fraction—of a business that delivers products and services and earns a profit. Just as the true value of the home is the benefits of living in it, the true value of our investment in a business like Microsoft is our share of the future stream of cash flow the business will generate. Today’s market price simply tells us how a buyer and seller agree to quantify that value at this moment.
Steering Clear of Mr. Market
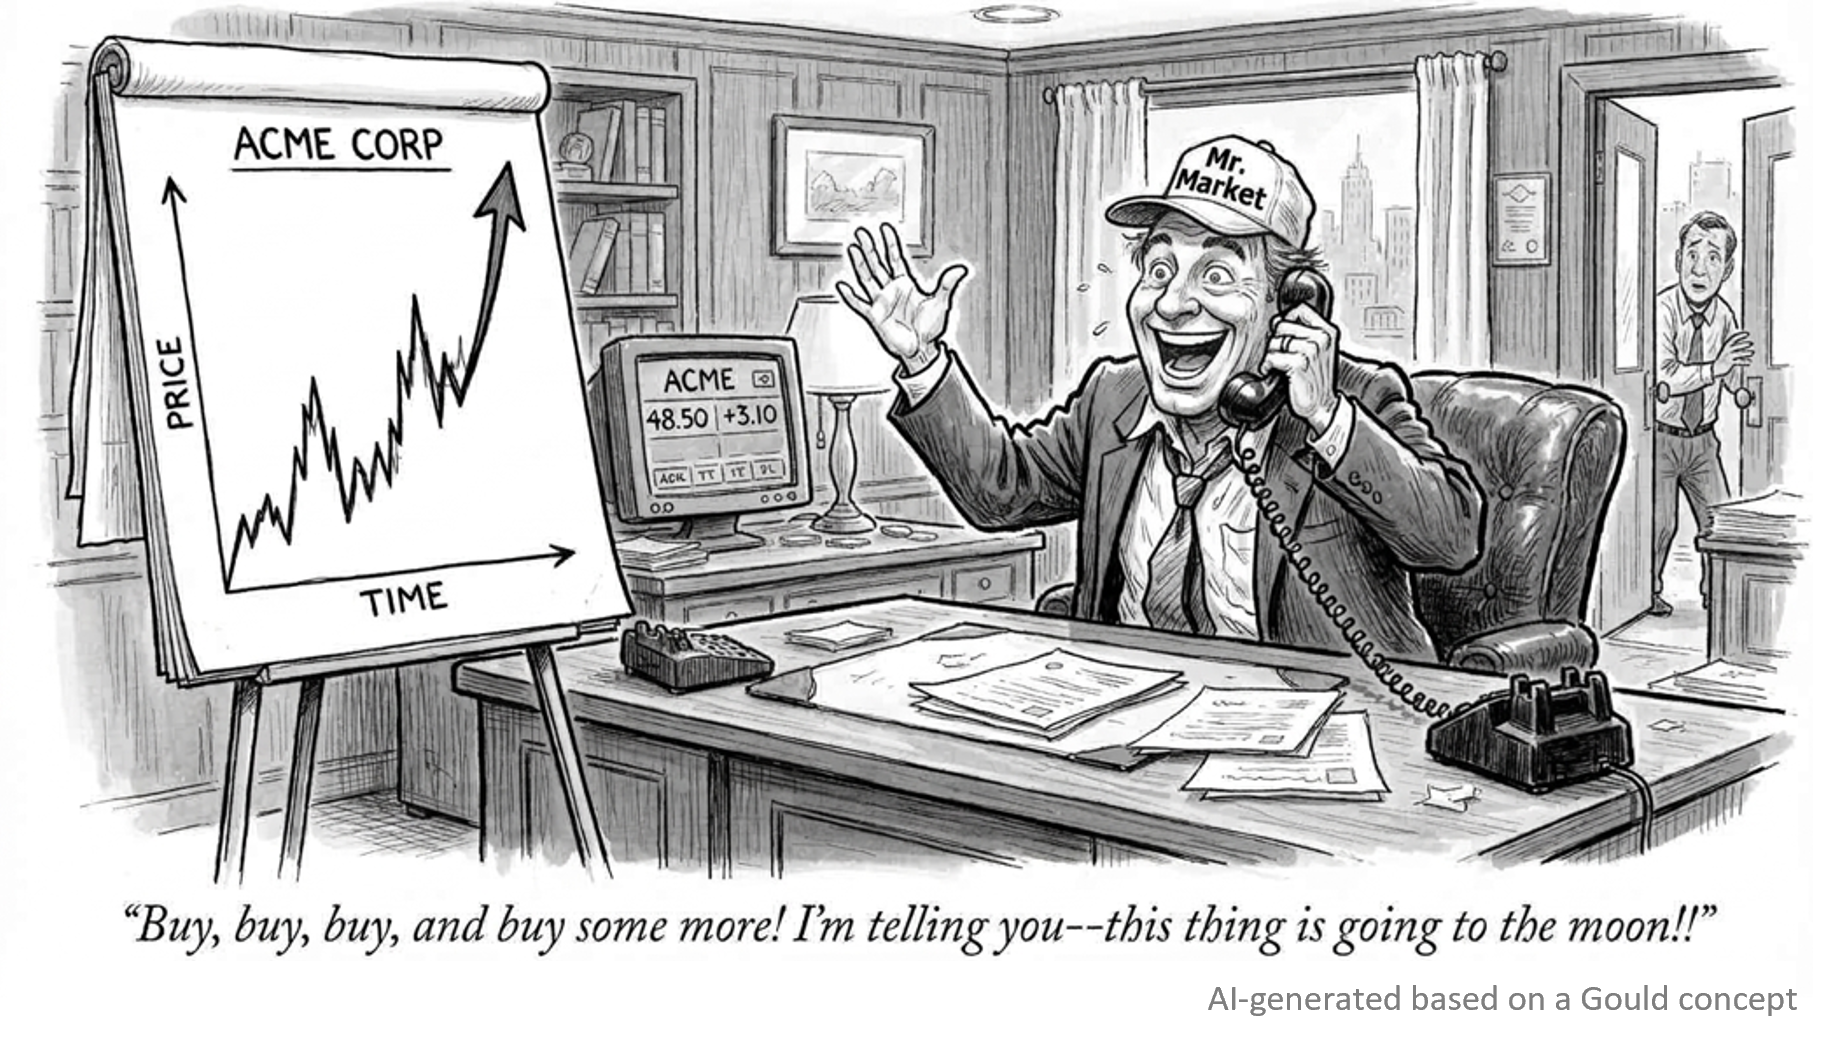
Fabled investor Benjamin Graham cleverly connected market prices to the swings of human emotion through his fictional “Mr. Market.” Graham observed that group psychology could lead investors (Mr. Market) to periods of excessive optimism[2] or pessimism, causing market prices to move to nonsensical levels, either much higher or lower than a dispassionate valuation of the underlying business.
Graham would likely see today’s Mr. Market as bordering on euphoric. A quick way to measure optimism is to look at how much investors pay today for one dollar of corporate earnings, also known as the price-to-earnings (P/E) ratio. Today’s P/E ratio is high by historical standards. That dollar of earnings is also historically expensive when compared to what one pays today for a dollar of bond interest.
Graham thought that by reading Mr. Market’s moods, he could improve investment returns, selling to the optimists and buying from the pessimists. Count us as skeptical. It is true that stock market prices periodically diverge from the rational, as may be the case today. But seeking to profit from such dislocations is both exceedingly difficult and potentially hazardous.
The Perils of Market Timing
When we are convinced that prices are out of whack, it’s always tempting to try to time the market, but let us count the pitfalls. Suppose a crystal ball tells us that a 46% market drop will begin within five years. What do we do? If the market continues to barrel upward and peaks in three years at 86% above today’s level,[3] a 46% drop will just bring the market back to today’s level.[4] Selling today will have gained very little; in fact, after capital gains taxes, our portfolio might be well below its starting position.
Lacking a crystal ball,[5] potential outcomes of market timing are even more sobering. We do not know the timing or magnitude of the next bear market, we won’t be able to identify it until the market is long past its peak, and we likely won’t believe it’s over until a new uptrend is well established, meaning we’ll miss the best time to reinvest.
Investing as a Statement of Optimism
When we invest in a diversified portfolio of stocks—through an index fund, for example—we buy a cross-section of the businesses that make up the broad economy. We do so with belief that the economy will grow over our time horizon and that the companies we own will, on average, benefit from that growth. Remember, too, that we are investing for a period that makes Mr. Market’s incessant chattering just so much noise.
While such faith has mostly been rewarded over the past century, there are no guarantees that the future will mirror the past. We also understand that ignoring Mr. Market is easier said than done. For these reasons, we diversify almost every portfolio across stocks, bonds, and other assets, consistent with each client’s tolerance for market value fluctuation. In the meantime, we are here to provide you with market noise cancellation, among many other things.
For a detailed discussion of the economy, financial markets, and investment performance, be sure to see the Q2 Economic and Market Review.
As always, we thank you for your business and for the trust you place in us daily. Please call or email whenever we can be of assistance.
The Gould Asset Management Team
[1] Hedge fund manager Cliff Asness makes a similar point, arguing (contrary to conventional wisdom) that some investors will pay more for private (non-traded) investments than for comparable publicly traded investments precisely because private investments are illiquid (therefore immune to the risks of market timing) and valued in a way (infrequently and likely understating their volatility) that reduces investor anxiety.
In 1976, Roger Ibbotson and Rex Sinquefield, former classmates at the University of Chicago, published their seminal work, "Stocks, Bonds, Bills, and Inflation: Year-by-Year Historical Returns (1926–1974).” Their study, nicknamed SBBI, was the first to provide reliable data on the historical returns of U.S. financial markets, and its impact was huge.
For the first time, analysts could confidently measure the extra return investors had earned on stocks as compared to bonds, how much additional risk that entailed, and how well stocks and bonds had kept up with inflation. Fifty years later, the updated SBBI now includes a full century of historical returns. The story it tells is remarkable and holds lessons for all investors.
An Astounding Century of Returns
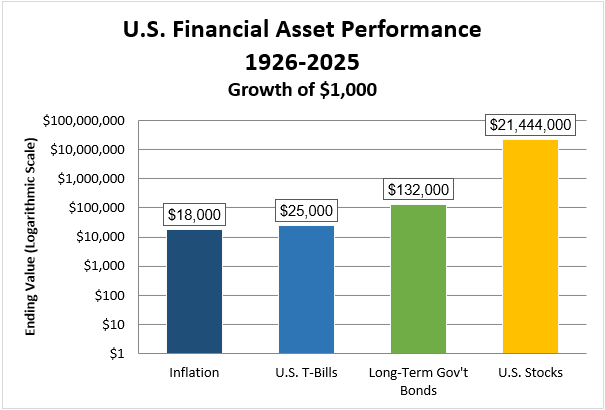
If you invested $1,000 in U.S. large cap stocks at the beginning of 1926, your portfolio would have grown to $21,444,000 by the end of 2025. You read that correctly. If you’re thinking that there’s been lots of inflation over the past century, you’re right. It takes about $18,000 today to match what $1,000 bought a century ago. Still, the purchasing power of the investment grew about 1200-fold, an astonishing feat.
Meanwhile, the same $1,000 invested in long-term U.S. government bonds grew to about $132,000: not bad, but only a tiny fraction of what stocks delivered. The same amount invested in U.S. Treasury bills grew to about $25,000, only modestly ahead of inflation.
Return and Risk
Stock prices fluctuate in response to corporate earnings, economic growth, interest rates, inflation, shocks like war and pandemic, and more. In contrast, high-quality bond prices are far less volatile. Financial theory argues that as compensation for accepting a much bumpier ride, stock investors should earn greater returns in the long term. The SBBI data bears this out. The compound annual growth rates of stocks and bonds over the last century were 10.5% and 5.0%, respectively. The extra 5.5% in annual return from stocks translated into 162 times more money after 100 years, a testament to the wonders of long-term compounding.
But before loading up on stocks, consider their risks. Since 1926, stock investors have endured all sorts of unpleasantness, ranging from overnight crashes to multi-year bear markets to decade-plus stretches of poor returns. The S&P 500 plunged 20.5% in the October 1987 “Black Monday” crash and later experienced prolonged downturns of 49% in the 2000-2002 “Dot-Com Bust” and 57% in the 2007-2009 “Great Financial Crisis.” For the 1966-1981 period, almost a full generation, U.S. stocks failed even to match inflation.
Hazardous Extrapolation
For newer investors, these cautionary tales probably seem like ancient history, making the idea of a bear market something of an abstraction. And with the U.S. stock market mostly soaring over the past 17 years, even veteran investors have dimming memories of bygone traumas.
Against this backdrop, some investment industry voices are calling for very aggressive long-term portfolio allocations (e.g., 90% stocks, 10% bonds/cash), pointing to stocks’ massive performance edge over the last century. Proponents of these high-octane portfolios commonly cite comforting statistics drawn from SBBI data, for example, that stocks have beaten bonds in more than 90% of all 20-year periods in the last century. The implication is that long-term investors can ignore shorter-term fluctuations in portfolio value.
Here's the rub. In my experience, very few investors can tolerate a rapid 40%-50% drop in their portfolio value, something a 90-10 investor would already have experienced twice since 2000. Investors who take on more risk than they can stomach invariably slash their stock holdings after a substantial market decline, locking in losses and limiting gains in subsequent market recovery. The 90-10 mix might have worked for Rip Van Winkle (who took a 20-year nap), but real-life investors must have portfolios they can live with in the short term if they are to benefit from stocks’ long-term higher expected returns.
One More Big Caveat
On one hand, SBBI is a big data set, the kind financial analysts love, with more than 1,200 monthly data points across multiple assets. On the other hand, it covers just a single century in a single country whose markets survived and thrived. Not all countries were so fortunate. Germany and Japan saw their stock markets go to zero in the wake of World War II. The SBBI data on U.S. markets shows just one of many possible outcomes.
Historical investment returns are like history books: instructive, but not necessarily predictive. Facing an uncertain future, an investor’s best tools are diversification, attention to risk, and a measure of cautious optimism. Investors who can absorb the lessons of SBBI, without mistaking past returns for a guarantee, will be better prepared for whatever the coming century brings.
Donald Gould is president and chief investment officer of Gould Asset Management of Claremont.Don is a recurring guest columnist for the Courier, providing his unique insights and observations on matters of money, investing, and personal finance.