Today’s stock market looks expensive by historical standards. By expensive, we are not talking about the price of stocks, but rather their value—how much we pay for a dollar of corporate earnings, or profits. That measure is called the price-to-earnings (P/E) ratio.
Divide Microsoft’s stock price of $510 by its earnings-per-share of $18 and you get a P/E ratio of 28. Do this for every stock and you can calculate the whole market’s P/E ratio. The accompanying chart shows that today’s market P/E is near its all-time high reached in 2000.
Today’s stock market: Fairly priced, or in a bubble?
There are two main schools of thought on why stocks might look expensive right now. The “efficient market hypothesis” (EMH) argues that prices fairly reflect all information available in the moment. If P/E ratios are historically high, EMH says there must be a good reason. As an example, today’s high P/E ratios might reflect a consensus that AI will accelerate corporate profit growth by increasing efficiency or creating whole new categories of economic activity. The expectation of increased future earnings would justify a higher P/E than before. Bolstering the case for EMH is the lightning speed with which information now moves around the globe and is digested by markets.
The second school focuses on the “animal spirits” that often dominate investor behavior. British economist John Maynard Keynes coined that term to describe how mass psychology periodically drives markets sharply above or below any reasonable measure of their true value. Bouts of widespread euphoria can lead to bubbles in markets for stocks, real estate, and other assets. A storied example: At the peak of the Dutch tulip bulb craze of the 1600s, a single bulb reportedly fetched ten times the annual wage of a skilled craftsman. Likewise, extreme pessimism can color investors’ perceptions. After a decade of high inflation and poor stock market returns, a famous 1979 BusinessWeek cover declared the “death of equities.” Three years later, stocks turned sharply higher, a trend they’ve maintained for most of the past 44 years.
What should a stock market investor do?
If you subscribe to the EMH school, the long-term investor should not change course in response to today’s expensive market. Though the market looks expensive, it’s priced fairly and should deliver a return in line with its risk. So, instead of worrying about whether stocks are overpriced or a bargain (since EMH says they are neither), investors should keep their focus on asset allocation, making sure their portfolio is well diversified and properly reflects their tolerance for risk.
And if today’s prices reflect animal spirits more than logic? Market history is awash in bubbles. If you are over 40, you likely remember the dot-com mania of the late 1990s, when investor rapture over the world-changing potential of the internet pushed the tech-heavy Nasdaq index skyward by about 600% over a 5-year period. The internet did indeed change the world, but investors wildly overestimated its impact on corporate profits. The Nasdaq peaked in March 2000 and then plunged nearly 80% over the next 19 months, giving back almost all its gains of the late 1990s. It was not until 2015 that the index recaptured its 2000 high point.
Today’s AI boom shares characteristics with the dot-com bubble, with companies (and their investors) committing trillions of dollars to AI infrastructure in a race with highly uncertain returns. There are important differences between the two periods, as well. The public companies spending the largest amounts on AI are mostly established and solidly profitable businesses, which was not the case in the dot-com era. Will future earnings justify today’s lofty stock prices? We’ll only know in hindsight.
An investor who is convinced that prices are out of whack due to animal spirits might be tempted to try to time the market. This path is littered with pitfalls.
First, even if you know you’re in a bubble, you still have no idea how much bigger the bubble will get and how long it will take to peak. Suppose a crystal ball tells you that a 46% market drop will begin within five years. What do you do? If the market continues to barrel upward and peaks in three years at 86% above today’s level—about what the US stock market has gained over the last three calendar years—a 46% drop will just bring the market back to today’s level. (The math: (100+86) x (100%-46%) ≈ 100.) Selling today will have gained very little; in fact, after capital gains taxes, your portfolio might be well below its starting position.
Several additional factors argue for staying the course even if you think investor emotions are distorting market prices. No one knows the timing or magnitude of the next bear market. We can’t identify an extended downturn until the market is long past its peak. And most won’t believe the market has reached its low point until a new uptrend is well established. The sobering upshot: it’s highly unlikely we’ll sell at the top or buy at the bottom.
The Surprising Conclusion…and One Caveat
So, it turns out that if the simple objective is making money, it doesn’t matter much whether or not the market is priced correctly. If it’s priced correctly (per EMH), then there’s nothing to be gained from trading. And if it’s in a bubble, arguably the hazards of market timing more than offset any potential gains.
That said, there is still one argument in favor of reducing stock exposure in an overpriced market, and it has to do with risk. The most severe bear markets tend to be those that follow the biggest runups. If you’re convinced we’re in a bubble, trimming your stock allocation might help you sleep better at night, knowing that your portfolio will decline less when the bubble eventually pops. There is great value in a good night’s rest.
Donald Gould is chairman and chief investment officer of Gould Asset Management of Claremont.Don is a recurring guest columnist for the Courier, providing his unique insights and observations on matters of money, investing, and personal finance.
I am very pleased to announce that effective September 1, 2026, Gould partner and senior portfolio manager Johnny DeBiase will become President of Gould Asset Management. As President, Johnny will oversee the company’s day-to-day business activities.
I will continue to serve as Chief Investment Officer, overseeing investment policy. I will also take on the newly created Chairman role, providing strategic direction and leading communications with clients and the outside community.
Johnny DeBiase joined Gould in 2012 and became a partner in 2016. Working alongside partners Tom Carr, Scott Smith, Derek Baldwin, and the whole Gould team, he has been a key contributor to the company’s growth from six to fifteen people and from under $400 million in assets under management to more than $1.1 billion.
Please join me in congratulating Johnny DeBiase on his appointment as President!
Note: This post is an excerpt from Gould Asset Management’s Economic and Market Review for the Second Quarter of 2026. The excerpt is posted here for the benefit of our blog subscribers.
Stocks Rally in Q2 as Technology Leads Rebound
Global stock markets rebounded sharply in Q2. Investors reacted favorably to an interim US-Iran agreement aimed at ending the conflict and reopening the Strait of Hormuz, leading to lower oil prices. Renewed enthusiasm for artificial intelligence and strong corporate earnings helped investors look past lingering concerns over inflation and interest rates.
US large-cap stocks, represented by the S&P 500 Index, surged 15.2% in Q2, lifting year-to-date returns to 10.2%. The rally more than offset a difficult first quarter. Roughly 85% of S&P 500 companies beat earnings expectations.
Technology led all US sectors in Q2, rocketing 43.5% and pushing its year-to-date gain to 32.7%, as chipmakers and other AI infrastructure companies benefited from rising earnings expectations, strong demand for high-end semiconductors, and continued datacenter investment. Industrials also performed well, gaining 14.9% in Q2 and 20.2% year-to-date, supported by demand tied to AI infrastructure, electrical equipment, defense, and energy investment. Utilities were the weakest-performing sector, declining 0.5%, as defensive areas of the market fell somewhat out of favor
Tax-exempt municipal bonds recorded a strong quarter, returning 2.5% as the market rebounded from a sharp March loss. On a tax-equivalent basis, municipal bond yields reached very attractive levels relative to Treasurys early in Q2, supporting strong investor demand.
Looking ahead, the bond market is likely to remain focused on whether the US economy can sustain the strength it showed during the Iran conflict and whether inflation will begin to moderate. Investors will also be closely watching the early months of new Fed Chair Kevin Warsh's tenure. His suggestion that Federal Reserve officials should communicate less frequently could leave markets with fewer signals about the future path of monetary policy, contributing to greater volatility in fixed income markets.
REITs Rally as Q1 Alternatives Leaders Retreat
Alternatives performance was mixed in Q2, with real estate investment trusts (REITs) posting strong gains while gold, energy stocks, and commodities declined. The sharp retreat in oil prices reversed many of the trends that had driven alternatives higher in Q1, as markets responded favorably to an interim US-Iran agreement and the partial resumption of shipping through the Strait of Hormuz. Despite the quarterly pullback, energy and commodities remain solidly positive for the year.
Gold fell 12.6% in Q2, a sharp reversal from the record highs reached earlier in the year, leaving the precious metal down 6.5% year-to-date. Several of the factors that had supported gold began working against it, including softer demand from gold ETF investors, a stronger US dollar late in the quarter, higher US Treasury yields, and a more hawkish Fed outlook.
Your monthly account statements from the custodian show the “market value” of each investment, which add up to your portfolio value. What do those numbers actually mean?
Suppose you own 100 shares of Microsoft (symbol: MSFT). At the close of the New York Stock Exchange, on June 30, 2026, at 4 pm Eastern Daylight Time, MSFT’s price was $373.02 per share. Your June statement will say you owned Microsoft stock worth $37,302. In fact, what it really says is that if you had sold your 100 shares at that same price, you would have received $37,302.
At any point in time, however, most investors are holders, not sellers. For holders, today’s price may be unimportant, just in the same way your home’s price on Zillow, though fun to check, is irrelevant if you don’t intend to sell soon. For the long-term investor, the market price of MSFT is an unhelpful distraction. It causes us to focus too much on what we might be able to sell for right now and not enough on what the investment might do for us over the time we plan to hold it.[1] But how else can a long-term investor value an investment in stock?
The answer starts with a reminder that “shares” represent ownership of a share—a fraction—of a business that delivers products and services and earns a profit. Just as the true value of the home is the benefits of living in it, the true value of our investment in a business like Microsoft is our share of the future stream of cash flow the business will generate. Today’s market price simply tells us how a buyer and seller agree to quantify that value at this moment.
Steering Clear of Mr. Market
Fabled investor Benjamin Graham cleverly connected market prices to the swings of human emotion through his fictional “Mr. Market.” Graham observed that group psychology could lead investors (Mr. Market) to periods of excessive optimism[2] or pessimism, causing market prices to move to nonsensical levels, either much higher or lower than a dispassionate valuation of the underlying business.
Graham would likely see today’s Mr. Market as bordering on euphoric. A quick way to measure optimism is to look at how much investors pay today for one dollar of corporate earnings, also known as the price-to-earnings (P/E) ratio. Today’s P/E ratio is high by historical standards. That dollar of earnings is also historically expensive when compared to what one pays today for a dollar of bond interest.
Graham thought that by reading Mr. Market’s moods, he could improve investment returns, selling to the optimists and buying from the pessimists. Count us as skeptical. It is true that stock market prices periodically diverge from the rational, as may be the case today. But seeking to profit from such dislocations is both exceedingly difficult and potentially hazardous.
The Perils of Market Timing
When we are convinced that prices are out of whack, it’s always tempting to try to time the market, but let us count the pitfalls. Suppose a crystal ball tells us that a 46% market drop will begin within five years. What do we do? If the market continues to barrel upward and peaks in three years at 86% above today’s level,[3] a 46% drop will just bring the market back to today’s level.[4] Selling today will have gained very little; in fact, after capital gains taxes, our portfolio might be well below its starting position.
Lacking a crystal ball,[5] potential outcomes of market timing are even more sobering. We do not know the timing or magnitude of the next bear market, we won’t be able to identify it until the market is long past its peak, and we likely won’t believe it’s over until a new uptrend is well established, meaning we’ll miss the best time to reinvest.
Investing as a Statement of Optimism
When we invest in a diversified portfolio of stocks—through an index fund, for example—we buy a cross-section of the businesses that make up the broad economy. We do so with belief that the economy will grow over our time horizon and that the companies we own will, on average, benefit from that growth. Remember, too, that we are investing for a period that makes Mr. Market’s incessant chattering just so much noise.
While such faith has mostly been rewarded over the past century, there are no guarantees that the future will mirror the past. We also understand that ignoring Mr. Market is easier said than done. For these reasons, we diversify almost every portfolio across stocks, bonds, and other assets, consistent with each client’s tolerance for market value fluctuation. In the meantime, we are here to provide you with market noise cancellation, among many other things.
For a detailed discussion of the economy, financial markets, and investment performance, be sure to see the Q2 Economic and Market Review.
As always, we thank you for your business and for the trust you place in us daily. Please call or email whenever we can be of assistance.
The Gould Asset Management Team
[1] Hedge fund manager Cliff Asness makes a similar point, arguing (contrary to conventional wisdom) that some investors will pay more for private (non-traded) investments than for comparable publicly traded investments precisely because private investments are illiquid (therefore immune to the risks of market timing) and valued in a way (infrequently and likely understating their volatility) that reduces investor anxiety.
In 1976, Roger Ibbotson and Rex Sinquefield, former classmates at the University of Chicago, published their seminal work, "Stocks, Bonds, Bills, and Inflation: Year-by-Year Historical Returns (1926–1974).” Their study, nicknamed SBBI, was the first to provide reliable data on the historical returns of U.S. financial markets, and its impact was huge.
For the first time, analysts could confidently measure the extra return investors had earned on stocks as compared to bonds, how much additional risk that entailed, and how well stocks and bonds had kept up with inflation. Fifty years later, the updated SBBI now includes a full century of historical returns. The story it tells is remarkable and holds lessons for all investors.
An Astounding Century of Returns
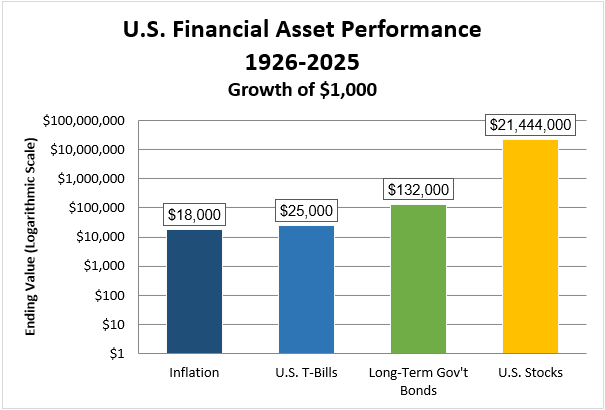
If you invested $1,000 in U.S. large cap stocks at the beginning of 1926, your portfolio would have grown to $21,444,000 by the end of 2025. You read that correctly. If you’re thinking that there’s been lots of inflation over the past century, you’re right. It takes about $18,000 today to match what $1,000 bought a century ago. Still, the purchasing power of the investment grew about 1200-fold, an astonishing feat.
Meanwhile, the same $1,000 invested in long-term U.S. government bonds grew to about $132,000: not bad, but only a tiny fraction of what stocks delivered. The same amount invested in U.S. Treasury bills grew to about $25,000, only modestly ahead of inflation.
Return and Risk
Stock prices fluctuate in response to corporate earnings, economic growth, interest rates, inflation, shocks like war and pandemic, and more. In contrast, high-quality bond prices are far less volatile. Financial theory argues that as compensation for accepting a much bumpier ride, stock investors should earn greater returns in the long term. The SBBI data bears this out. The compound annual growth rates of stocks and bonds over the last century were 10.5% and 5.0%, respectively. The extra 5.5% in annual return from stocks translated into 162 times more money after 100 years, a testament to the wonders of long-term compounding.
But before loading up on stocks, consider their risks. Since 1926, stock investors have endured all sorts of unpleasantness, ranging from overnight crashes to multi-year bear markets to decade-plus stretches of poor returns. The S&P 500 plunged 20.5% in the October 1987 “Black Monday” crash and later experienced prolonged downturns of 49% in the 2000-2002 “Dot-Com Bust” and 57% in the 2007-2009 “Great Financial Crisis.” For the 1966-1981 period, almost a full generation, U.S. stocks failed even to match inflation.
Hazardous Extrapolation
For newer investors, these cautionary tales probably seem like ancient history, making the idea of a bear market something of an abstraction. And with the U.S. stock market mostly soaring over the past 17 years, even veteran investors have dimming memories of bygone traumas.
Against this backdrop, some investment industry voices are calling for very aggressive long-term portfolio allocations (e.g., 90% stocks, 10% bonds/cash), pointing to stocks’ massive performance edge over the last century. Proponents of these high-octane portfolios commonly cite comforting statistics drawn from SBBI data, for example, that stocks have beaten bonds in more than 90% of all 20-year periods in the last century. The implication is that long-term investors can ignore shorter-term fluctuations in portfolio value.
Here's the rub. In my experience, very few investors can tolerate a rapid 40%-50% drop in their portfolio value, something a 90-10 investor would already have experienced twice since 2000. Investors who take on more risk than they can stomach invariably slash their stock holdings after a substantial market decline, locking in losses and limiting gains in subsequent market recovery. The 90-10 mix might have worked for Rip Van Winkle (who took a 20-year nap), but real-life investors must have portfolios they can live with in the short term if they are to benefit from stocks’ long-term higher expected returns.
One More Big Caveat
On one hand, SBBI is a big data set, the kind financial analysts love, with more than 1,200 monthly data points across multiple assets. On the other hand, it covers just a single century in a single country whose markets survived and thrived. Not all countries were so fortunate. Germany and Japan saw their stock markets go to zero in the wake of World War II. The SBBI data on U.S. markets shows just one of many possible outcomes.
Historical investment returns are like history books: instructive, but not necessarily predictive. Facing an uncertain future, an investor’s best tools are diversification, attention to risk, and a measure of cautious optimism. Investors who can absorb the lessons of SBBI, without mistaking past returns for a guarantee, will be better prepared for whatever the coming century brings.
Donald Gould is president and chief investment officer of Gould Asset Management of Claremont.Don is a recurring guest columnist for the Courier, providing his unique insights and observations on matters of money, investing, and personal finance.
The Trump Account: A Powerful Opportunity Hidden in the Details
For parents and grandparents thinking generationally, the new Trump Accounts contain one of the most compelling wealth building opportunities we have seen in years. This is not so much for what the accounts are on their own, but for what they can become.
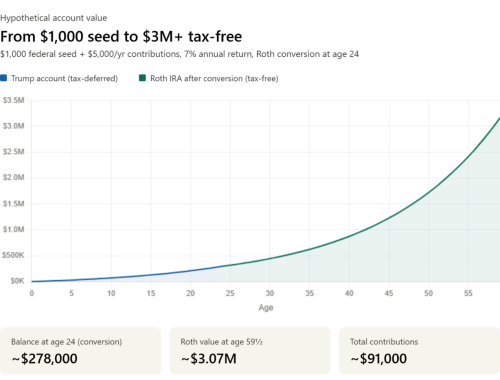
Here is the short version: fund a Trump Account aggressively from birth, wait until your child is in their early 20s and likely still earning a modest income, then convert it to a Roth IRA, paying minimal taxes on the conversion. Done right, roughly $90,000 in contributions could seed a tax-free retirement account worth over $3 million by age 60. We will show the math in a moment.
As a savings vehicle on its own terms, the Trump Account is fine but not exceptional. For most purposes, a 529 or a Roth IRA will serve you better. But if you have already funded those, the Trump Account deserves a close look.
What Is a Trump Account?
Beginning this summer, parents and guardians can open a Trump Account for any child under 18, funded with after-tax dollars up to $5,000 per year, a limit that adjusts for inflation starting in 2028. The accounts must be invested in a US stock index fund until the child turns 18, at which point the rules shift and the account begins following IRA-style tax treatment. Children born between 2025 and 2028 also receive a $1,000 seed contribution from the federal government to get things started. As of mid-March, roughly four million children already have Trump Accounts, with more than 800,000 eligible for the $1,000 government contribution.
Employers and charities can contribute as well, and some high profile donors have stepped in with additional seed money, including Michael and Susan Dell, who have pledged $250 for each child age 10 or under living in a zip code with a median household income below $150,000.
How Do These Compare to 529s?
If your primary goal is saving for college, a 529 plan is clearly the better tool. Contributions to a 529 grow tax-free and come out tax-free when used for qualified education expenses. Many states offer an additional deduction on contributions. Trump Accounts carry none of those education-specific advantages. For families who need to prioritize college savings, the 529 should come first.
Parents and grandparents should maximize their own 401(k)s, IRAs, and 529s before considering a Trump Account. The sequencing matters. Think of the Trump account as the next layer, not the foundation.
The Big Opportunity
If your family can fund one of these accounts aggressively ($5,000 a year, every year, from birth through age 17) and your child has the knowledge and discipline to leave it alone as an adult, there is a potentially extraordinary outcome waiting at the other end.
The math goes like this. Assume the $1,000 in government seed money, $5,000 in annual contributions for 18 years, and a 7% annual return. By the time your child is in their early 20s, the account value will approach $300,000. At that point, if they are in a low tax bracket as many young workers are, they can convert the account to a Roth IRA and pay minimal taxes. Rather than converting all at once, a smart approach is to spread the conversion over a few years, keeping each year's taxable income in a lower bracket and meaningfully reducing the total tax owed.
The conversion tax, paid with outside dollars as a gift from parents or grandparents rather than drawn from the account itself, is quite modest relative to the potential gains. What you've done, in effect, is pre-funded a Roth IRA on your child's behalf at a fraction of the cost of a lump-sum Roth conversion.
From there, the Roth IRA grows completely tax-free for decades. By age 60, that $278,000 conversion, left untouched, would grow to just over $3 million. No required minimum distributions. No ordinary income tax on withdrawals. Just a tax-free nest egg that has been quietly compounding since birth. Put another way, you've used roughly $90,000 in after-tax contributions, plus a modest conversion tax payment, to potentially set your child up with a multimillion dollar tax-free retirement account.
A small note on timing: experts caution against converting immediately at 18. The "Kiddie Tax," which can apply to unearned income for certain individuals under 24, may cause part of the conversion to be taxed at the parents' rate rather than the child's. Patience here pays. Waiting until the child is working, independent, and clearly in a low bracket (typically the early-to-mid 20s) is the smarter move.
Understanding the Risks
This strategy has potential pitfalls that should be understood from the outset.
The first risk is behavioral. The entire thesis depends on your child, in their early 20s, making the disciplined choice not to cash out what may seem like found money. A young adult with more than a quarter million dollars on hand and competing financial priorities is not a guaranteed long-term investor. Helping the child understand the benefits of long-term tax-free compounding will create the best chance of realizing the full potential of these accounts.
The second risk is legislative. Tax laws change. The 529-to-Roth conversion rules, which were themselves a relatively recent and welcome addition to the tax code, already carry a $35,000 lifetime cap. Future Trump Account legislation could impose similar caps, restrict conversions for accounts above a certain balance, or find other ways to tax the transaction more heavily if a low-bracket conversion starts to look too generous. Today's rules might not be permanent. But even if rules change, we see little downside to this strategy.
And, of course, while we have assumed a 7% rate of return, future returns are never guaranteed.
The Bottom Line
The Trump Account is not a replacement for the tools you already have. Fund your own retirement first. Keep the 529 at the top of the priority list for college savings. But if you've done those things and have the capacity to think a generation ahead, this is a genuinely compelling new vehicle because of the Roth conversion opportunity it opens. For those eligible children, the $1,000 seed money is frosting on the cake.
A Trump Account for a child born this year, funded consistently, converted to a Roth IRA in early adulthood, and left to compound for decades, could enable the child to retire with financial security, all because of a decision you made before they ever knew what a tax return was.
As always, the details of your specific situation matter. Tax brackets, other savings priorities, the age of your children, and your estate planning goals all factor in. If you'd like to explore whether this strategy makes sense for your family, we are here to help. Call or email us anytime
As always, we thank you for your business and for the trust you place in us daily. Please call or email whenever we can be of assistance.
Note: This post is an excerpt from Gould Asset Management’s Economic and Market Review for the First Quarter of 2026. The excerpt is posted here for the benefit of our blog subscribers.
US Enters 2026 on Uncertain Footing
The US economy expanded at an annualized rate of just 0.5% in the fourth quarter of 2025, down sharply from 4.4% in the third quarter. A 43-day partial government shutdown that began in October subtracted roughly one percentage point from growth, while exports and business investment also weakened.
Consumer spending stalled in the early months of 2026. Inflation-adjusted spending was flat in January and rose just 0.1% in February, with motor vehicle purchases providing much of the lift. Rising energy costs tied to the Iran conflict pose additional headwinds ahead.
The job market was uneven through the quarter, but the broader trajectory points to gradual cooling. Nonfarm payrolls rebounded from a 133,000 decline in February to a 178,000 gain in March, though net job creation for the quarter was minimal. The unemployment rate edged down to 4.3%, but the improvement reflected a shrinking labor force rather than stronger hiring.
Manufacturing activity turned positive in January for the first time in nearly a year and expanded for a third consecutive month in March. The ISM Manufacturing PMI rose to 52.7 in March, its highest reading since August 2022. However, cost pressures intensified, with the ISM prices index jumping to 78.3, its highest level since June 2022, reflecting the impact of tariffs and elevated energy costs on input prices.
The Fed’s Holding Pattern
The Federal Reserve held the federal funds rate steady at 3.50% to 3.75% at both of its meetings during the quarter, citing elevated economic uncertainty and inflation that continues to run above its 2% target. The March decision was nearly unanimous, with only one dissenting vote in favor of a cut.
Fed Chair Jerome Powell acknowledged the economy is performing reasonably well,while noting that theongoing conflict in the Middle East has meaningfully clouded the outlook. Powell described the current rate range as broadly neutral, neither stimulating nor restraining growth, and emphasized a data-dependent approach, offering no preset path for future adjustments.
The Fed’s latest projections reflect a modest upgrade to the growth outlook alongside higher inflation expectations. Officials now project GDP growth of 2.4% in 2026, up from 2.3% in December, and see core inflation ending the year at 2.7%, up from the prior 2.5% forecast. The median projection still calls for one rate cut in 2026, though seven of nineteen voting and non-voting participants now pencil in no cuts at all this year.
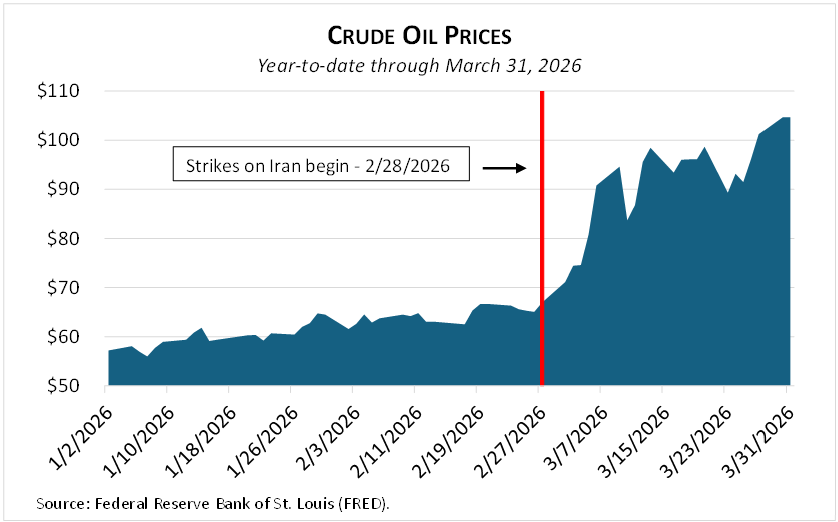
After a modestly positive first two months of the year, markets were jolted by the joint US/Israel surprise airstrikes on Iran at the end of February, triggering a worldwide slide in stock prices that continued through most of March.
Iran’s effective closure of the Strait of Hormuz immediately reduced world oil and gas supplies by roughly 10% and 20%, respectively, causing prices to soar. The net importers of Asia and western Europe saw energy costs spike 50%-150%. Even in the energy-rich US, gasoline prices are up over 30% in just a month. Rising energy costs inevitably mean higher prices for almost all goods.
As we saw during the Covid pandemic, the modern economy depends on highly interdependent global supply chains. When chain links break, unintended consequences follow. Case in point—the Middle East is a major source of fertilizer and helium exports, both curtailed by the war. A lasting fertilizer shortage would mean higher food prices everywhere and potential crop failures, especially in developing countries. Helium is needed for a variety of industrial processes, from making the chips that power AI to the cooling of MRI machines.
As we write this, a tenuous two-week cease-fire is in effect, a first round of negotiations did not result in agreement, and the US has imposed a limited blockade on the Strait of Hormuz. Rumors of further talks are circulating, but the fog of war is dense. The situation is fluid and unpredictable.
Investment Implications
In this conflict, markets must contend with an unusually long list of unknowns. Will the cease-fire hold? Will it lead to a lasting peace or will hostilities soon resume? Will the Strait of Hormuz reopen, how fully, and when? When will this war be over for good? (Prediction market odds on an end by June 30 jumped from 50% to 85% since the cease-fire announcement.) How quickly can energy supplies rebound to pre-war levels, especially considering war damage to oil and gas infrastructure? How might the post-war geopolitical landscape look different? Answers to these questions could determine whether the global economy continues its expansion or falls into recession, so it’s no surprise that markets gyrate with each hint of either resolution or escalation.
Markets and central banks find themselves in the uncomfortable spot of worrying at once about both inflation and recession. Energy supply shocks push up prices—one stark example is a doubling of transcontinental airfares in March alone. But more money spent on airfare leaves less money for everything else. Absent a jump in household income, a sudden rise in the price of something as essential as energy will tend to depress economic activity.
Higher inflation expectations push up bond yields and generally lead to tighter monetary policy (higher short-term interest rates), while recession fears do the opposite. Market yields have reflected this tug-of-war in recent weeks, rising through most of March but easing towards month-end as recession concerns grew. The Fed faces a conundrum.
The war has also pressured the US bond market in other ways. A recent Bloomberg article notes that reduced oil revenue is lessening Middle East oil producing nations’ demand for US Treasurys, while higher oil prices are forcing emerging markets governments to sell Treasurys to cover their higher energy bills. Both actions tend to push yields up and bond prices down.
Yet with all that as a backdrop, in the first half of April, US stocks recovered all their March losses, demonstrating again the market’s ability to confound.
Patience and Perspective are Your Friends
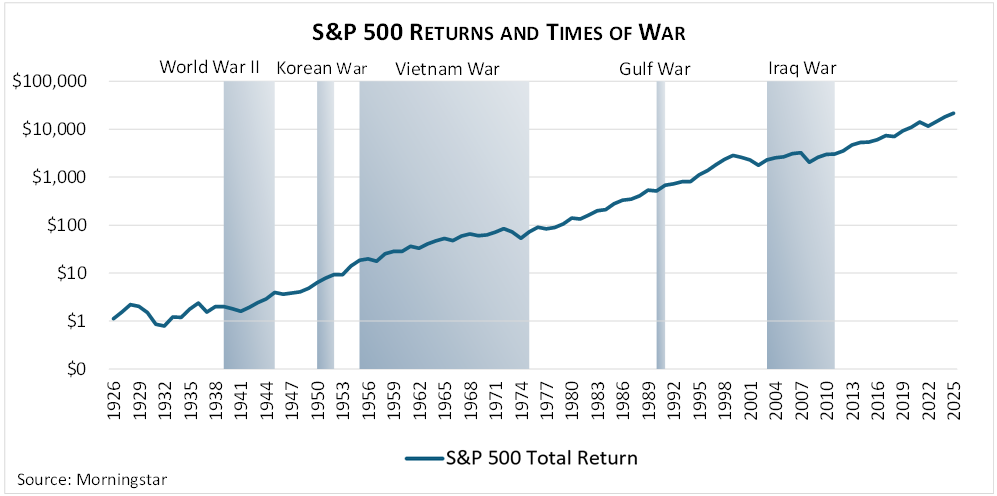
When it feels like the world is spinning so fast that it might come off its axis, we counsel patience and perspective. All wars eventually end, some quickly and some not, some in a lasting resolution and others in stalemate. This conflict is no exception. Short attention spans, as well as political and economic pressures, favor a quicker end, but the jury is still out. The end, when it comes, might be messy and inconclusive. Even a quick resolution will leave world commerce bruised for some period, but history suggests that economies have a natural tendency towards repair, recovery, and resumed growth.
Your advantage amid the discord is that your investment portfolio has a very long attention span. While its market value unavoidably bounces around in response to the nonstop din emanating from the world’s capitals, your portfolio is neither distracted nor diverted from its long-term mission. We aim to keep it that way.
AI Omnipresence
Like you, we watch in amazement as AI finds its way into the nooks and crannies of our work and home lives. We marvel at the capabilities of chatbots like OpenAI ChatGPT, Google Gemini, and Anthropic Claude. Challenged with complex questions, in seconds they spin out well written, thoughtfully organized, apparently deeply researched, highly polished, authoritative sounding answers.
Since the industrial revolution, technology has lessened the need for physical human labor, sending many of us to gyms just to keep our bodies from falling into disrepair. AI is the next step in this evolution, evidently reducing our need to think, as well. Will we all need to rely on Sudoku and Wordle to keep our brains from atrophying?
A cautionary note: remember that the “A” stands for artificial. The intelligence is magnificent, but it is not human. We need to beware the wax museum aspect of all this. That figure of Ronald Reagan at Madame Tussaud’s in Las Vegas looks so lifelike that we feel the Gipper might speak at any moment. And yet, even if skillfully animated to walk and talk, it’s still not Reagan. Likewise, we need to stay alert to the important difference between human and artificial intelligence.
Our business—helping clients achieve lifetime financial security—is fundamentally a human-to-human interaction between advisor and client. What we do requires intelligence, but also critical thinking, empathy, and always a commitment to putting our clients’ interests first. We keep these in mind as we think about the rapid emergence of artificial intelligence in our professional and personal lives.
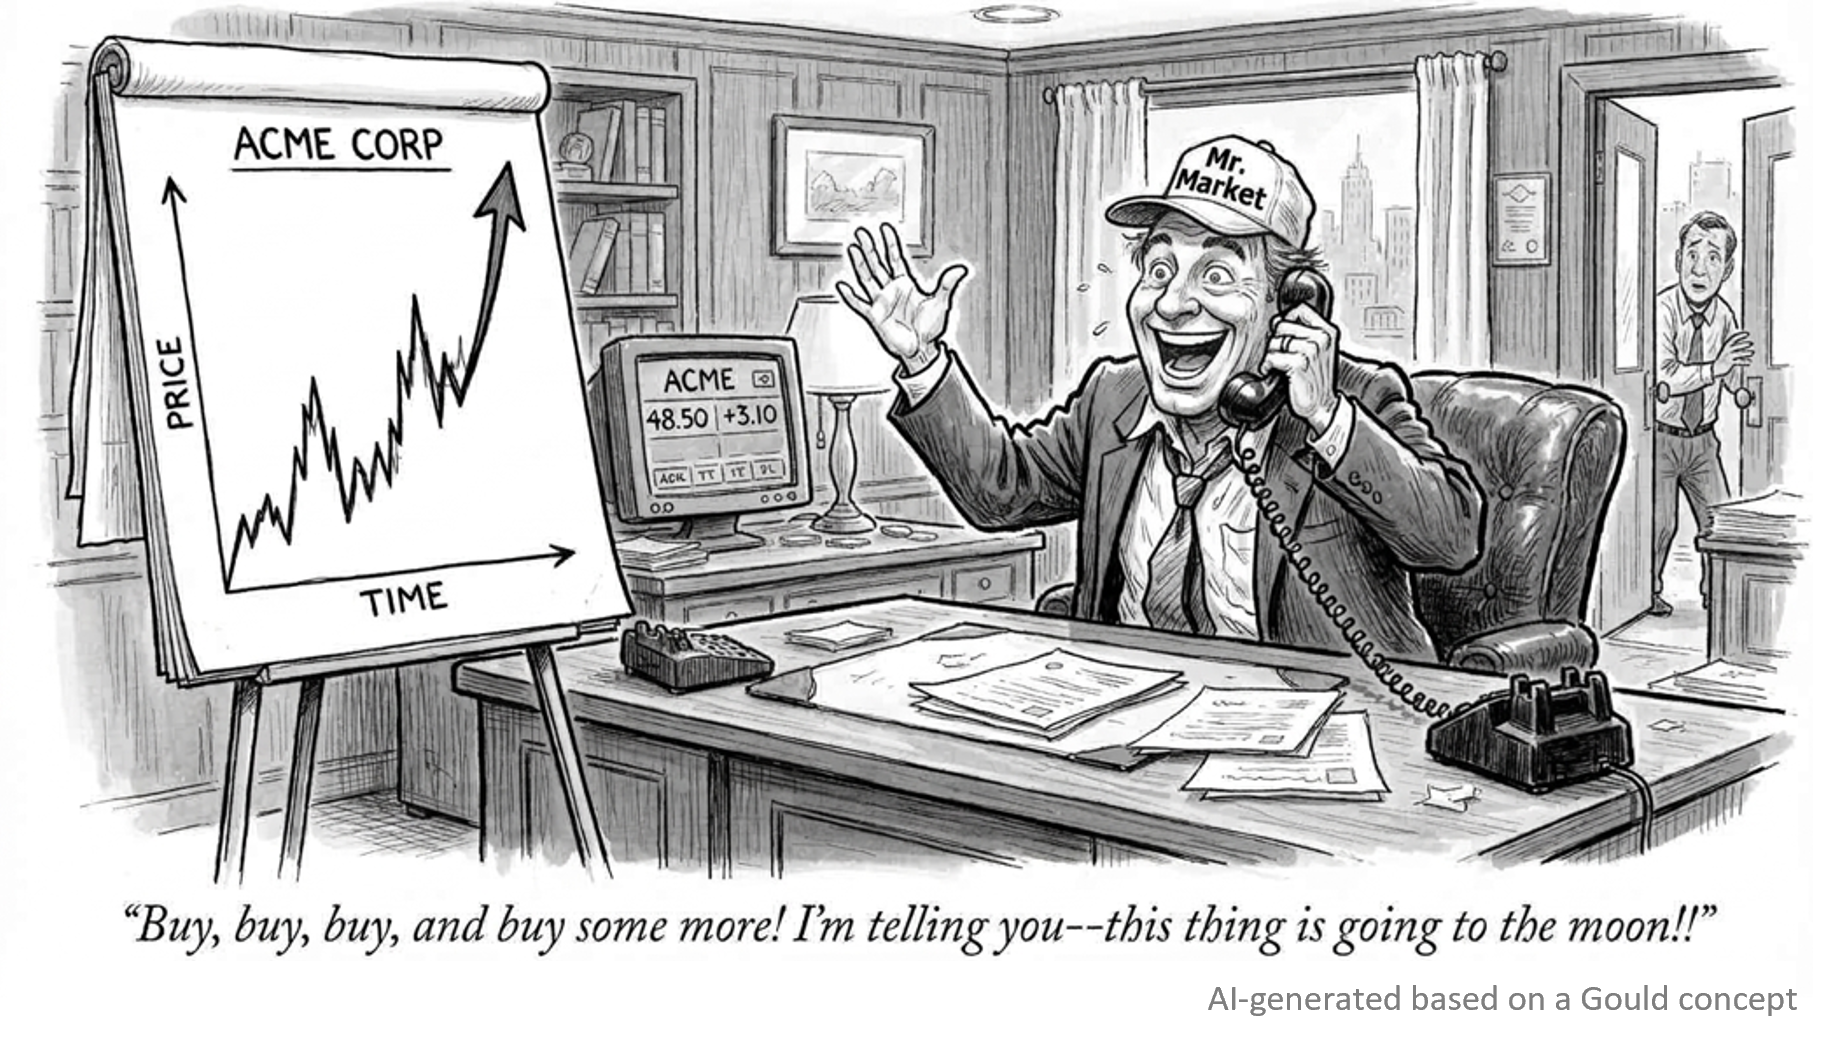
PS – The cartoon above, which pokes fun at AI’s limitations, was generated in less than one minute from a prompt we gave to Google Gemini AI.
For a detailed discussion of the economy, financial markets, and investment performance, be sure to see the Q1 Economic and Market Review.
As always, we thank you for your business and for the trust you place in us daily. Please call or email whenever we can be of assistance.
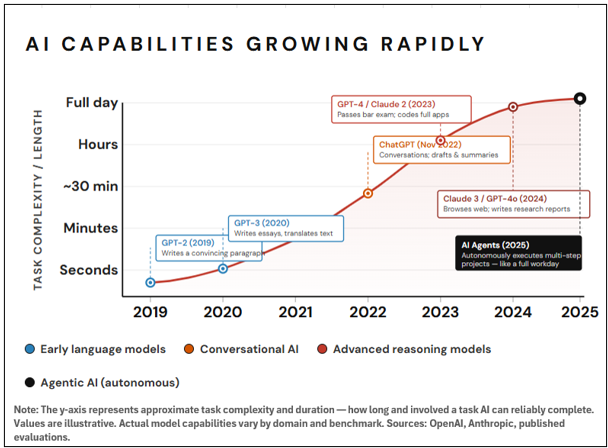
If you love trains, you understand the big difference between knowing a train is due soon and actually seeing the massive engine rounding the bend. For months or even years, artificial intelligence experts have told us to prepare for the arrival of an AI that builds ever more powerful versions of itself. Well, now it’s in sight, horn blaring and ground shaking.
Over the past few weeks, leading AI developers Anthropic and OpenAI have each released new versions with computer programming capabilities that veteran software engineers describe as both astonishing and terrifying. The AI can now do software coding at a level comparable to experts with decades of experience. Soon, its capabilities will zoom past that.
Concurrently, we are told that much of the latest AI was built by the AI itself. This so-called “self-recursive” activity implies ever more powerful AI models, released with increasing frequency.
Productivity Up. Unemployment to Follow?
The most immediate impact of these developments is felt by software coders themselves. Suddenly, they are vastly more productive, as AI can now employ an army of virtual agents to quickly do most of the previously laborious coding work. But this same advance might also make many coders redundant. We read stories of Stanford grads with computer science degrees—once a golden ticket to lucrative employment—facing a more difficult entry level job market.
Of course, AI’s impact doesn’t stop with coders. In a world where almost every business is to varying degrees a technology enterprise, the implications are enormous. Over time, as with technological advances dating back at least to the start of the Industrial Revolution, we can expect AI to take over a wide range of tasks currently performed by humans.
The optimistic take on this envisions a future of greater output and wealth, with employees quickly elevating their work to more valuable activities. The more worrisome outlook is that AI advances quicker than the average worker can adapt, leading to high levels of unemployment. Such impact would be most immediately felt in white collar jobs that are mostly performed on a computer. However, in time, AI-enhanced robotics could replace blue collar workers, too.
AI and Your Investments
The stock market is doing its best to digest all the AI news. We see its verdict rendered in the daily movement of stock prices, much of it very volatile of late. Right now, there are many more questions than answers. Here are a few that are top of mind.
The tech giants (Google, Meta, etc.) are pouring hundreds of billions of dollars annually into building datacenters in a sort of AI arms race that many view as winner-take-all. How will they earn a fair return on these massive investments? And what becomes of the losers in this race?
AI can help companies in many ways, including enabling the creation of new products and services, increasing worker productivity, and reducing labor costs. Will these benefits more than offset the potential reduction in consumer demand resulting from an AI that puts people out of work?
It appears that AI can quickly replicate complex software that may have taken thousands of engineers decades to build and refine. Does this mean AI will ultimately bankrupt countless companies whose primary value resides in their proprietary software?
Economist Joseph Schumpeter coined the phrase “creative destruction” to describe the process by which technological advances lay the groundwork for both the introduction of the better mousetrap and the obsolescence of what came before. With AI, it is very possible we will witness creative destruction of a scale and speed well beyond anything ever experienced.
What is an investor to do in the face of all this? It is impossible to know in advance who the winners and losers will be in the brave new world of AI. The possibility that there will be a very small number of big winners and a much larger number of losers makes the task more challenging still.
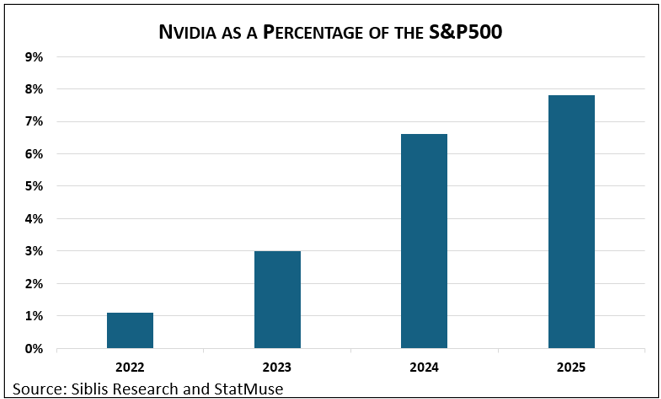
It is wisely said that if you must own the needle in the haystack, you should buy the haystack. Put another way, stay diversified. Index funds—which own the entire market—ensure that you will participate in the growth of the market’s top performers. A prime example is Nvidia, maker of the graphics processors so critical to AI. Its share of the S&P 500 ‘s total value grew from about 1% to well over 7% in just the past three calendar years, which is even more remarkable considering that the index nearly doubled in that timeframe.
It also makes sense to diversify across asset categories, for example, stocks, bonds, real estate, and even perhaps precious metals such as gold. Diversification cannot ensure success. But in the face of AI-fueled rapid change with unpredictable consequences, it might just make failure less likely.
Donald Gould is president and chief investment officer of Gould Asset Management of Claremont.Don is a recurring guest columnist for the Courier, providing his unique insights and observations on matters of money, investing, and personal finance.
Note: This post is an excerpt from Gould Asset Management’s Economic and Market Review for the Fourth Quarter of 2025. The excerpt is posted here for the benefit of our blog subscribers.
Stocks Advance in Q4, Capping a Strong 2025
Global equity markets posted steady gains in Q4, with several major indexes finishing the year near record highs. International stocks outperformed US equities for the first time in several years, aided by a weaker US dollar, more attractive valuations overseas, and rotation away from US tech stocks. Solid earnings growth and expectations central banks would continue lowering interest rates in 2026 supported markets.
US large-cap stocks, represented by the S&P 500 Index, rose 2.7% in Q4 and finished 2025 up a strong 17.9%. Much of the year’s advance was driven by the technology and communication sectors tied to artificial intelligence. Within that group, Alphabet (up 65%) and Nvidia (up 39%) accounted for a disproportionate share of market gains, underscoring the continued influence of a relatively narrow set of leaders.
Sector performance in Q4 highlighted continued shifts in market leadership. Health Care was the strongest performing sector for the quarter, rising 11.7% and finishing the year up 14.6%, while Communication Services gained 7.3% in Q4 and 33.6% year-to-date. Technology posted more modest gains in the Q4 (up 2.3%) but delivered a strong 24.7% return for the year.
US mid and small cap stocks, measured by the Wilshire 4500 Index, were mostly flat in Q4, slipping 0.3%, but ended the year up a 11.9%. After keeping pace with large caps for much of 2025, smaller companies lagged late in the year as investors gravitated toward larger, more established firms amid economic uncertainty.
International stocks were among the strongest performers of 2025, extending gains in the fourth quarter. Developed-market equities rose 4.9% in Q4 and finished the year up 31.2%, while emerging-market stocks gained 4.7% for the quarter and 33.6% for the year. Returns were broad based, with strong performance across Europe, parts of Asia, and emerging markets, supported by improving economic momentum and attractive valuations. A weaker US dollar—down 7.2% in 2025—provided a tailwind for international investors.
Market volatility increased briefly during Q4 but remained contained overall. The VIX Index began the quarter around 16 and spiked above 26 in November amid a brief market sell-off and concerns around interest rate policy. Volatility eased to 15 by yearend, suggesting investors closed 2025 with a steadier outlook.
Fed Rate Cuts Support Solid Q4 for Bonds
US fixed income markets posted modest gains in the fourth quarter, capping the strongest year for bonds since 2000. Short-term Treasury yields continued to decline in Q4 as the Federal Reserve cut its benchmark rate twice by a total of 0.50%. Meanwhile, yields on longer-term Treasurys rose slightly as concerns about significant US fiscal deficits persist. As measured by the Bloomberg US Aggregate Bond Index, US bonds gained 1.1% in the final quarter of 2025, bringing the full-year return to 7.3%.
A sharp steepening of the US Treasury yield curve was a defining feature of both Q4 and 2025 overall. After beginning 2025 at 4.25%, the 2-year Treasury yield, which is highly sensitive to expectations for Federal Reserve policy, declined from 3.60% to 3.47% in Q4. In contrast, the 30-year Treasury yield rose from 4.73% to 4.84% during the quarter, leaving it little changed for the year.
Mortgage backed securities outperformed other fixed income sectors in Q4, returning 1.7% for the quarter and 8.6% for the year. High yield bonds also delivered strong results, gaining 1.6% in Q4 and 8.6% for the year. Long term Treasurys underperformed, returning -1.0% for the quarter and 4.2% for the year.