
by Don Gould
The media bombards us daily with economic and financial statistics. Housing starts were up. Jobless claims were down. Consumer confidence is fluctuating. The purchasing managers index was flat. And so on. It’s enough to make your head spin.
But there is a single economic indicator that contains a remarkable amount of information—the interest rate on the 10-year US Treasury Inflation-Protected Securities, or TIPS for short. If you could only follow one statistic, this would be the one. Why? Because using this single number you can capture: (1) inflation expectations (2) an idea of the long-term outlook for economic growth, and (3) the current risk-free rate of return, against which all other investment return expectations are calibrated.
In this article, part 1 of 2, I will focus on how TIPS can be used to estimate what level of inflation investors are expecting in coming years. Next week I will cover the rest.
TIPS – A Special Kind of Bond
First, some background. TIPS are a special kind of Treasury bond, introduced in the late 1990s. Like most bonds, TIPS pay an interest rate that is set when the bond is issued. Unlike other bonds, the TIPS’ principal amount is adjusted each year by inflation, as determined by changes in the Consumer Price Index (CPI). When prices are rising, as is typical, the fixed interest rate is applied to an increasing principal value each year, meaning the amount of interest paid goes up each year. At maturity, the TIPS holder receives a principal amount that has increased by the amount of inflation over the life of the bond. So, TIPS are a way to hedge against inflation and protect purchasing power over time.
In contrast, with a standard Treasury bond, both your annual interest payment and the principal you receive at maturity are fixed. if you pay $10,000 on its issue date and the interest rate is 3%, you will receive a fixed $300 per year for the life of the bond, plus the return of your $10,000 at maturity.
As you would expect, the interest rate on the standard bond is higher than the stated TIPS interest rate. The reason: for the TIPS holder, both the interest payments and the principal value rise each year by the inflation rate, whereas for the standard bond holder, they are stable. Here’s where it gets interesting.
Forecasting Inflation
Think of the difference between the stated interest rates on a standard Treasury bond and a TIPS bond with the same maturity as a rough estimate of the market’s expected average inflation rate over the life of the bonds. For example, if our standard 10-year Treasury bond pays 3% while a 10-year TIPS pays 1%, that suggests investors expect about 2% inflation per year (3% minus 1%) over the coming ten years. Bond investors call this the “break-even” inflation rate—that is, the inflation rate at which the standard Treasury bond and the TIPS bond will have the same rate of return.
Today, a normal 10-year Treasury bond pays an interest rate of about 1.6%, while a 10-year TIPS has an interest rate of negative 0.9%. Yes, negative. I won’t bog you down in the details of that, but the same arithmetic applies. The difference between 1.6% and negative 0.9% is 2.5%, so investors expect about 2.5% annual inflation between now and 2031.
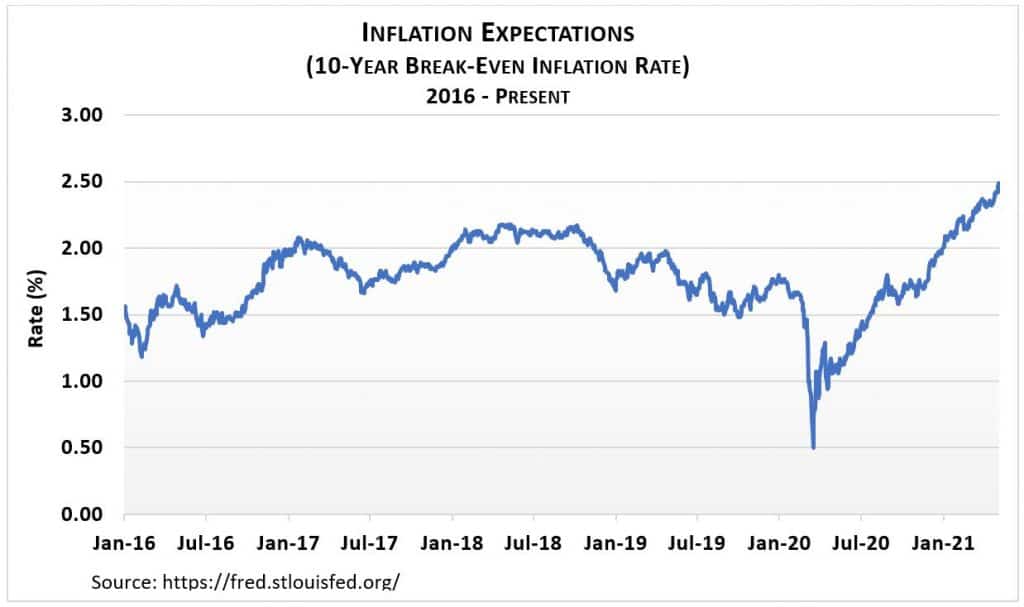
Looking at this differential over time shows how inflation expectations have changed. The accompanying graph charts the break-even rate over the past five years. You can see how inflation expectations plunged last year at the outset of the pandemic—economic slowdowns invariably put a lid on prices generally. Note also how the inflation forecast has recently rebounded to levels exceeding pre-pandemic highs. Many attribute this to both the ongoing economic recovery and the massive amounts of money the Federal Reserve has created in the past year to start and sustain that recovery.
That’s Interesting. But Why is it Useful?
Knowing what inflation rate people are expecting gives businesses an idea of how fast their input costs (employee compensation, materials, rent, etc.) might rise and therefore how they might need to raise prices to maintain sales and profits. It tells workers how much more they might need to earn over time to maintain their standard of living. It guides investors on how much their investments must grow to maintain or increase purchasing power. And for Claremont’s many pensioners who rely on programs such as Social Security, CalPERS, and CalSTRS, it shows what kind of cost-of-living adjustments could be needed to preserve real (inflation-adjusted) income.
Gauging inflation expectations might be most important of all to economic policymakers such as the Federal Reserve. The Fed has targeted an average rate of 2% as the optimal level of inflation. Below that, the central bank worries about deflation, an environment of falling prices where it is feared consumers will delay purchases in the hopes of buying at lower prices later. Conversely, at much above 2% inflation, the Fed may raise interest rates to brake the economy and tamp down inflation expectations.
Next Week: Using the TIPS interest rate to assess economic growth prospects and baseline investment returns.
Don Gould is president and chief investment officer of Gould Asset Management.