On March 20, the Dodgers open their 2024 campaign in Seoul, South Korea against the San Diego Padres. The game’s location is part of the effort by Major League Baseball (MLB) to build international interest in baseball. Fittingly, the game will feature baseball’s top global star, Shohei Ohtani, in his Dodgers debut.
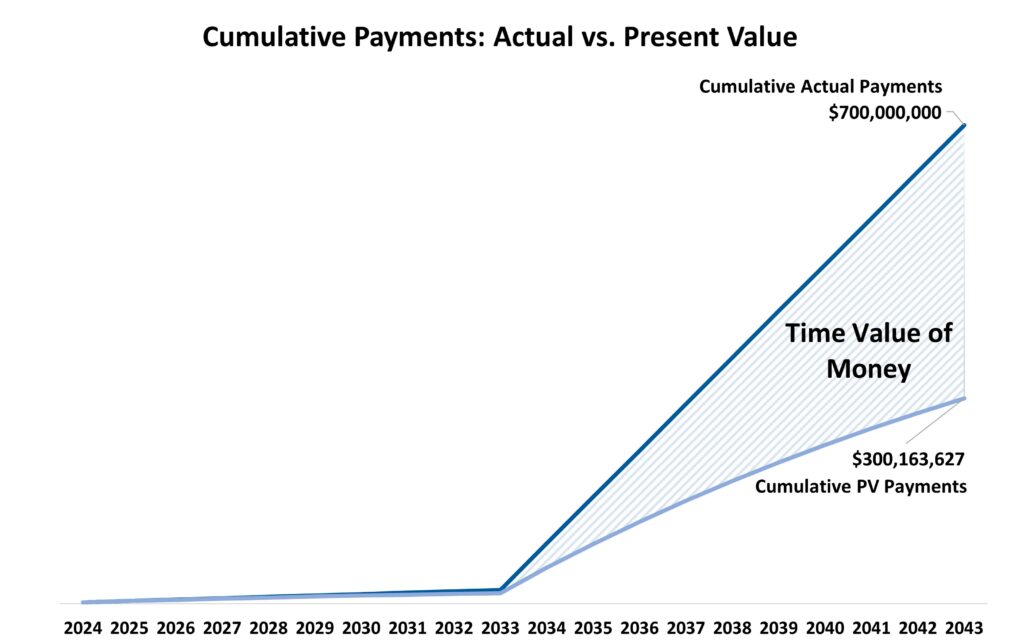
Much as I would enjoy talking baseball, this is a money column, so instead I’m going to review Ohtani’s jaw-dropping $700 million contract. The deal has captured the baseball world’s attention for both its size and unusual structure, with fully 97% ($680 million) of the contract to be paid out in the 10 years following Ohtani’s decade in a Dodgers jersey.
Much of the media’s breathless coverage of the contract is just plain wrong. Let’s review the myths and the facts.
Myth: Ohtani negotiated the largest contract in MLB history.
In dollar terms, $700 million exceeds all other contracts to date. But considering the time value of money and that most of the payouts are far in the future (2034-2043), the contract is not the largest. Case in point, Ohtani’s former Angels teammate, Mike Trout, garnered a richer contract in 2019.
Wait, you say. How can Trout’s $426.5 million be worth more than Ohtani’s $700 million? Easy. Trout’s contract is paid over the first 12 years in roughly equal annual installments. Also, interest rates were much lower in 2019, reducing the discount applied to Trout’s future cash flows.
The upshot: The present value of Ohtani’s contract is about $300 million, compared to Trout’s $340 million in 2019. Adjusting for the inflation since 2019, Trout’s contract would be worth about $415 million in 2024 dollars!
Myth: Ohtani’s salary deferrals improve the Dodgers’ cash flow, enabling the team to buy better players during his playing career.
This myth has two parts. One is that the deferrals free up cash to spend on Ohtani’s teammates. The other is that the Dodgers will be spared some “luxury tax,” a league penalty imposed on teams whose payrolls exceed a set limit. Neither is true.
The Dodgers could have paid Ohtani $40 million in each of his 10 playing years and arrived at the same $300 million present value. Meanwhile, MLB is assigning a $46 million annual salary for those same 10 years, requiring the Dodgers to deposit that amount annually into an escrow account to meet the future payments owed Ohtani. Compared to the simple $40 million/year contract, the Dodgers are spending an extra $6 million annually, and that same $6 million is also added to their luxury tax calculation each year.
Fact: Ohtani left a lot of money on the table, and this (and not the deferrals per se) leaves the team with more to spend on other players.
As great as Mike Trout was in 2019, he falls short of Ohtani, one of the game’s top pitchers and hitters, and MLB’s biggest ever global sensation. Given the same deferrals, Ohtani could have commanded a $1 billion contract. Why didn’t he? My guess: he cares more about winning than money, and the money he left on the table is money he expects the Dodgers will use to upgrade the lineup. (Note: while the deferrals themselves don’t free up cash, accepting a lower contract value does.)
Fact: Ohtani’s deferrals save him $30 million in California income tax.
Imagine (as I do), that in Game 7 of the 2033 World Series, Shohei throws the fall classic’s second ever perfect game, a 1-0 final decided by his walk-off homer with two outs in the bottom of the ninth. We can also predict that Mr. O, after a brief stop at Disneyland, will head straight up the I-15 to zero-income-tax Las Vegas. Establishing residency there will avoid California income tax entirely on the $680 million of deferred income.
The tax savings have a present value of roughly $30 million, recouping part of the contract money he left on the table—and at the expense of California’s tax collector, not the Dodgers.
Fact: Ohtani is taking most of the risk in this deal.
Shohei is taking some seriously big risks with the huge deferrals. For example, if inflation averages 3% instead of the 2% now forecast, the contract’s present value drops from $300 million to $265 million. With 5% inflation, the present value drops to $207 million, or by nearly a third. That’s not so impossible: inflation was running at 9% as recently as 2022.
A second risk is that the Dodgers can’t pay Ohtani the $680 million. That might sound farfetched, but much can happen in 20 years—a massive legal judgment against the team; a labor dispute that goes off the rails; a pandemic that shutters ballparks for years; or Congress ending MLB’s antitrust exemption. Use your imagination. In effect, Ohtani is accepting a $680 million IOU from the Dodgers. That’s a lot of eggs in one basket.
Ok, enough money talk. Play ball!
Don Gould is president and chief investment officer of Gould Asset Management of Claremont.
April 15th is just around the corner, and many of us are knee-deep in tax planning. When inundated with massive quantities of receipts, financial statements, forms, and spreadsheets, it can be all too easy to make errors that can lead to inaccurate calculations, delayed refunds, and penalties in worst-case scenarios.
Fortunately, many of these errors are easy to avoid or correct. To assist in the ultimate goal of pursuing your ideal financial future, here are some of the most common tax-planning mistakes and how to prevent them.
Missing Deadlines
Although April 15th happens every year (we checked), the deadline for filing taxes has a way of sneaking up on many people.
While it’s perfectly acceptable to file for an extension, one way or another, you need to give the IRS something by April 15th. Failing to give any notice whatsoever can result in a penalty of 5% of unpaid, owed taxes per month. Interest charges and other penalties may follow.
If you need to extend the April 15th deadline, you can submit Form 4868 to the IRS before that date, or simply make an electronic extension payment online (no need to file Form 4868). If you expect to owe taxes after filing, it’s a good idea to estimate how much you’ll owe and make at least a partial payment when requesting an extension.
Overlooking Credits, Breaks, and Deductions
Tax planning is a tough task. In trying to streamline the process, many taxpayers only count standard annual deductions and move on. In doing so, they miss out on tax credits and deductions they could have taken advantage of.
Credits are available for taxpayers in certain situations—those with children, those saving for retirement, those financing education, those supporting green initiatives, and more. Take the extra step of learning what tax advantages are available to you.
Providing Inaccurate Information
Whether you use automated software or an old-fashioned calculator, it’s a good idea to double-check your work to verify it’s accurate. This advice goes beyond mathematical errors; it also applies to changes to your personal info or bank account numbers and other common typos.
It’s important to be careful and accurate when calculating your finances. Rounding up deductions might be seen as incorrect by the IRS, and could potentially lead to an audit—which most people prefer to avoid!
Not Reporting All Income Sources (and Losses)
The days of having a single 9-to-5 job that accounts for all of a household’s income are gone. Realistically, they were never really there—investment dividends, retirement fund distributions, Social Security benefits, stock sales, and other miscellaneous revenue streams have always been reportable income sources.
However, with today’s gig economy and increasing diversity of income opportunities, it’s important not to skip over any financial gains—or, if applicable, capital losses. In addition, many financial institutions are foregoing mailing tax documents, opting instead to post them electronically. Just because you didn’t receive a tax form in the mail does not mean you don’t have taxable income that needs to be reported.
Missing Quarterly Estimated Tax Payments
For most of us, tax planning is only an annual chore centered around the April 15th deadline. But many self-employed or freelance workers, as well as those earning income from investments, may be required to file taxes four times a year. That’s because they’re in charge of their own paycheck deductions since they don’t have a regular employer to make them automatically.
If this situation applies to you, the IRS requests that you fill out and submit Form 1040-ES every quarter. It might be an additional hassle, but it could also instill a sense of discipline about tax planning. It may even optimize cash flow and put a cap on interest charges.
Not Getting Tax-Planning Help
If you find yourself underwater with tax planning, the best thing you can do is ask for help. Don’t hesitate to contact Gould Asset Management, a financial advising firm serving clients in Claremont, CA, and beyond. If you need a referral to a tax planning expert, we work with some of the best tax planners in the industry who understand the personal approach we take to every interaction and, like us, desire to help people turn their hard work into a prosperous future.
Johnny DeBiase is Partner and Senior Portfolio Manager at Gould Asset Management, an independent registered investment advisor based in Claremont, California. The firm manages customized portfolios on behalf of individuals, families, and nonprofits, and offers a range of services, including retirement planning, charitable giving strategies, and values-based investment options. As fiduciaries, they always put their clients’ interests first while providing best-in-class financial advice.
With responsibilities including portfolio management, market and investment research, and client relationship management, Johnny enjoys how investing combines numbers and finance with an element of human psychology. A big part of his job involves breaking down complex and emotionally charged topics like death and divorce, helping clients tune out the noise and see the big picture. He’s a firm believer that clients don’t stay for investments, they stay for client service.
Prior to joining the Gould team in 2012, Johnny interned for Fidelity National Information Services in their corporate tax department, analyzing data and assisting in the preparation of tax returns. He obtained his bachelor’s degree in economics with a minor in chemistry from the University of North Florida and his master’s degree in finance from the Robert Day School of Economics and Finance at Claremont McKenna College. He also holds the Chartered Financial Analyst® (CFA) designation and is a member of the CFA Institute. In his free time, he enjoys hiking with his wife, Jill, playing with his dogs, Millie and Lola, cooking, yoga, and reading fantasy and sci-fi books. To learn more about Johnny, connect with him on LinkedIn.
This first quarter of 2024 marks the four-year anniversary of the beginning of the Covid pandemic. Yes, hard to believe, but it’s really been four years since an invisible virus upended our world. Together, the pandemic’s onset and the subsequent performance of financial markets reinforce two points we preach daily.
First, the future is unknowable. On New Year’s Day 2020, hundreds of thousands thronged to the Rose Parade in Pasadena, and probably none could imagine a world in lockdown less than three months later.
Second, even if one could foretell the future like some Greek oracle, the markets’ response to that future will repeatedly confound you. We include in every quarterly report a chart that superimposes the period’s news headlines over a graph of stock market performance. The not-too-subtle message is that there’s usually not much connection between the headlines and the markets.
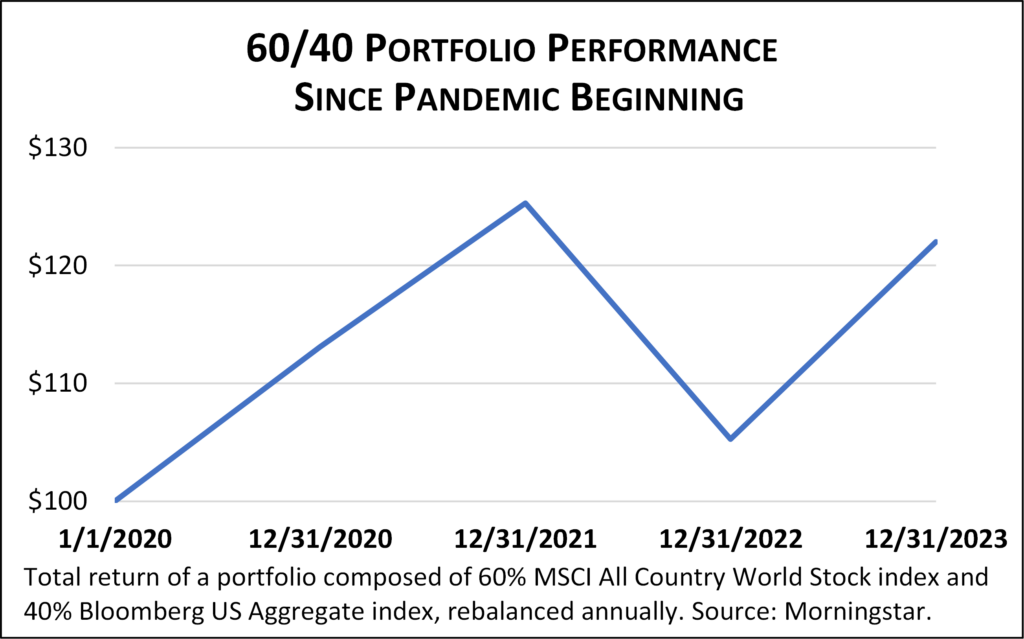
Returning to our case in point, if your crystal ball had told you that in the US alone the pandemic would cause an immediate loss of 25 million jobs, more than one million deaths, and stretch out 2-3 years, you probably would not have predicted very strong stock markets in three of the last four years or the highest inflation in decades. Yet, that’s what happened. Our Rip Van Winkle investor, who began a 4-year nap on New Year’s Eve in 2019, would have awakened this past New Year’s Eve (blissfully unaware of all the period’s turmoil) to find a balanced portfolio index[1] had compounded at a middle-of-the road 5% annual rate during the nap.
What a Difference a Year Makes
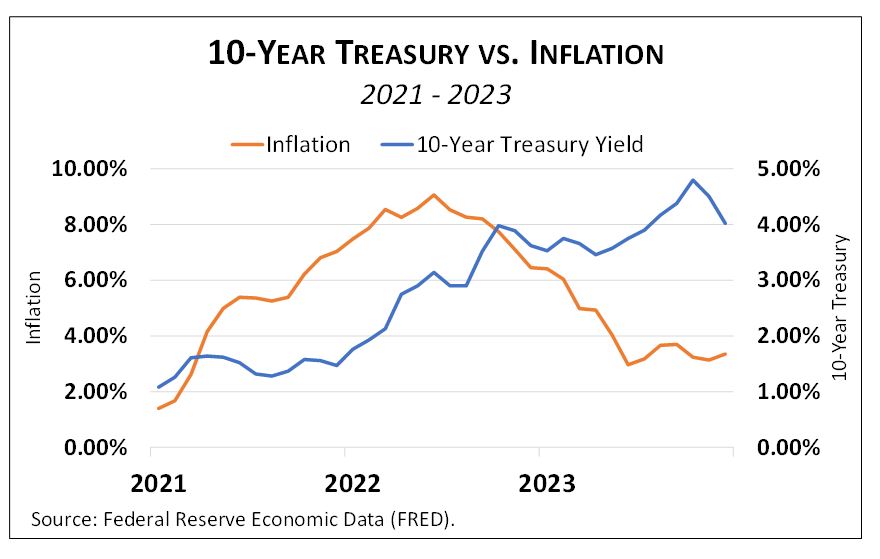
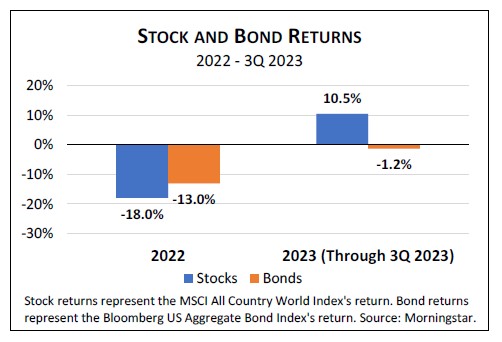
At this time a year ago, financial markets were licking their wounds after a historically bad 2022. Massive early pandemic government stimulus caused inflation to begin accelerating in early 2021. By mid-2021, central banks responded, initiating an 18-month series of interest rate hikes. Together, inflation and higher short-term rates pushed bond yields sharply higher through most of 2021 and 2022. In 2022, the leading US bond index delivered its worst return ever (by a wide margin), losing about 13%. (Remember, rising interest rates push down the price of existing bonds.) Stocks fell even more in 2022, down about 18%. With both main asset classes plunging, balanced portfolios of stocks and bonds turned in one of their poorest years on record in 2022.
Fast forward twelve months and the past year’s picture is radically different and better. With interest rates stabilizing, economies showing resilience and growth, and investors seeing big profit opportunities in artificial intelligence, global stocks rebounded nearly 23% last year, slightly more than erasing all of 2022’s decline. Meanwhile, US bonds were back in the plus column, returning about 5.5%. Inflation continued to subside throughout the year, leading the Federal Reserve to suggest in mid-December that the course of interest rates could soon pivot downward, good news for both stocks and bonds.
Playing the Long Game
While it’s fine to revel in 2023’s year-end statement values, especially after the trauma of 2022, we remind clients to stay focused on their longer investment time horizons. It’s easy to feel as high today as we felt low a year ago, but fear and greed are the long-term investor’s twin nemeses. Huge market swings over the past four years provided numerous opportunities for overreaction and self-inflicted wounds, for example, selling stocks early in the pandemic or after 2022’s historic decline, either of which would have been bad moves. A big part of our job is helping clients navigate these emotional swings, making sure we stay the course we’ve carefully established in calmer times.
2024 surely holds many more surprises in store, both in the news itself and how markets react to those headlines. We’ll do our best to make it a pleasant financial journey for you.
[1] Total return of a portfolio composed of 60% MSCI All Country World Stock index and 40% Bloomberg US Aggregate Bond index, rebalanced annually.
Note: This post is an excerpt from Gould Asset Management’s Economic and Market Review for the Fourth Quarter of 2023. The excerpt is posted here for the benefit of our blog subscribers.
Stocks Surge in Q4, Capping String Year, as Fed Signals Possible Rate Cuts
US stocks finished the year on a strong note, nearing all-time highs in late December, as inflation continued to moderate and the Fed suggested lower interest rates could be in store for 2024. The prospect of more accommodative monetary policy seemed to be the spark investors needed, resulting in US large cap stocks, as measured by the S&P 500 stock index, rising 11.7% in Q4, and finishing 2023 with a robust 26.3% gain.
A market cap-weighted indexed approach proved best in 2023, with a small number of large cap growth stocks accounting for a significant portion of US stock gains. This was evidenced by the top 10 stocks of the S&P 500 accounting for 86% of the S&P 500’s 26.3% gain.
Mid and small cap US stocks, as measured by the Wilshire 4500 index, outperformed large caps on the quarter, rising 14.3% in Q4 to cap a very strong year (up 24.9%). Lower interest rates and moderating inflation weighed positively on investor sentiment, increasing the belief among many that a “soft landing” might be within sight.
Except for Energy, all US sectors rallied sharply in the fourth quarter, led by Technology stocks (up 17.7%), followed by Financials (up 14.0%), and Industrials (up 13.0%). After underperforming in 2022, tech stocks were back on top once again, rising a remarkable 56.1% in 2023 and accounting for much of the S&P’s year-to-date gain.
International stocks were unable to keep pace with US equities, lagging for both the quarter and the year, despite a weak US dollar. The MSCI EAFE index, a measure of international developed market performance, rose 10.5% in the fourth quarter, finishing the year up 18.9%—noticeably lower than the 26%+ returns of US stocks. Emerging market stocks fared even worse, rising 7.9% on the quarter and 10.3% year-to-date, marking another year in which they trailed developed markets stocks.
Market volatility expectations were subdued on the quarter, common in strongly rising markets. The VIX volatility index fell from 17.5 at the start of the quarter to 12.5 by year end, levels not seen since before the pandemic.
The third quarter saw stocks and bonds both decline in the face of continuing Fed tightening. Inflation is down sharply from its 9% peak in mid-2022, but at 3%-4% it’s still above the Fed’s 2% target. So, rather than taking a relaxing summer at the beach, the Fed instead reiterated its intent to inflict still further pain on borrowers, which is how the central bank seeks to slow the economy and rein in inflation.
Rising interest rates pushed down the price of existing bonds, resulting in about a -3.2% return for the leading bond index. Higher bond yields also mean more competition for stocks—the leading global equity index was down a similar -3.3%. Still, 2023 has been a huge improvement over 2022. Again, it starts with bonds. We noted in January that by entering 2023 with significantly higher bond yields, bond investors had an important cushion should interest rates continue upward. Rates have indeed climbed further this year, but the year-to-date total return on bonds is about -1.2%; not wonderful, but leaps and bounds ahead of 2022’s record setting -13.0% loss. Likewise, even after the third quarter’s pullback, stocks closed the quarter up 10.5% year-to-date, as compared to 2022’s drubbing—an 18.0% decline.
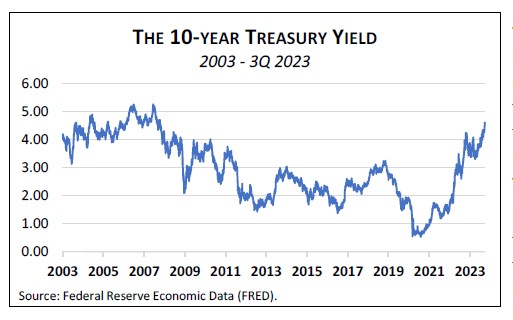
As we enter the fourth quarter, longer term interest rates have moved higher, with the benchmark 10-year Treasury yield approaching 5%, levels last seen in 2007. Higher long-term rates could mean that investors expect the Fed to keep short-term rates higher for a longer period than previously anticipated. Higher rates might also reflect the market’s concern over the large additional borrowings the Treasury must undertake to finance big budget deficits for the foreseeable future.
A Silver Lining for Bond Investors
Higher long-term interest rates are good news for some and bad news for others. Borrowers are hurt the most. Higher rates increase the cost of financing any purchase, from home mortgages to car loans to credit card balances. Real estate investments, because they are usually financed with substantial mortgage loans, are particularly vulnerable to higher rates. In contrast, clients with bonds in their portfolios benefit in the longer term from higher interest rates. Yes, it’s true that a jump in rates tends to push down the price of existing bonds. But if the average maturity of your bond portfolio is shorter than your investment time horizon (which describes almost all our clients), then the short-term decline in bond prices will be more than offset over time as bond interest and principal is reinvested at higher interest rates. And if the long-predicted recession finally materializes, high quality longer bonds should appreciate, providing a portfolio hedge.
Cash is alluring today with Treasury bills now paying over 5%. But as discussed in our recent blog post, rearranging a long-term asset allocation strategy to try to grab some short-term yield is historically a losing strategy. Remember—by definition, attractive short-term rates can only be locked in for the short term.
Stocks Outlook Hazy
Much less clear is the impact of rising interest rates on stocks. As a rule, higher returns on bonds push stock prices down to a level that makes stocks’ expected return competitive again with bonds and worth the extra volatility stock investors must shoulder.
Various measures show stocks to be expensive relative to bonds, based on historical averages. This does not, however, mean that stocks must go down. We have observed that stocks can remain “expensive” for a very long time, or even get more expensive. Alternatively, stocks can mark time while corporate earnings grow with the economy, making stock valuations gradually more attractive over time.
Whatever its near term course, stock market timing is hazardous. Even when an investor manages to sell before a drop, there is still the question of when to repurchase. In our experience, these investors rarely get back in before a recovery begins, and in most cases not until long after the upswing is underway.
Note: This post is an excerpt from Gould Asset Management’s Economic and Market Review for the Third Quarter of 2023. The excerpt is posted here for the benefit of our blog subscribers.
US Economy Steady Amidst Headwinds
The US economy grew at a 2.1% annualized rate in the second quarter, a slight deceleration from the previous quarter but still a healthy clip.
The labor market proved resilient in the third quarter, adding 336,000 jobs in September, the fastest pace in eight months. Wage growth moderated to 4.2% year-over-year and the headline unemployment rate remained unchanged at 3.8%.
Manufacturing activity continued to contract in the third quarter, with the ISM Manufacturing PMI consistently below the neutral level of 50. September marked the eleventh straight month of contraction, the longest stretch since the Great Recession. Falling input prices and a rebound in hiring provided a glimmer of hope.
Housing market challenges continued this quarter, with new home starts and sales declining amid rising mortgage rates. Existing home sales also fell due to limited inventory and affordability issues. Despite these issues, demand for housing remains robust.
The Fed – Higher for Longer
The Federal Reserve maintained its federal funds rate at a range of 5.25% to 5.50% after a 0.25% rate hike earlier in the quarter. The pause indicates the Fed's cautious and data-driven approach to tightening monetary policy, allowing time to assess the cumulative effects of previous interest rate hikes on the economy.
Still, Fed Chair Jerome Powell delivered a sobering message for financial markets – borrowing costs must remain higher for longer against a backdrop of sticky inflation and renewed strength in the economy.
Updated Fed projections show a stronger economy and job market in 2023-24 than previously forecast in June. As a result, the Fed expects to maintain a hawkish stance, penciling in one more interest rate hike before year-end. The Fed also expects to make only two interest rate cuts of 0.25% next year instead of the four they were projecting a few months ago.
Savers rejoice! Short-term interest rates, such as those on U.S. Treasury bills, recently breached the 5% level after sitting near zero for nine of the past 14 years. Cash is no longer trash; “financial repression” — that is, central banks keeping rates at rock bottom to stimulate the economy — is taking a welcome breather. As important, today’s cash interest rates are above the inflation rate, meaning that the purchasing power of cash is growing, in contrast to the zero-rate years when cash lost roughly 2% of its real value annually.
Of course, elevated interest rates are bad news for borrowers, but that’s precisely why the Federal Reserve has jacked up rates over the last year and-a-half. Higher rates slow the economy, helping fight post-pandemic inflation.
Getting your fair share
How much you benefit from today’s more generous rates depends on where you keep your cash. Some diligence is required. For example, you might think your checking or savings deposit at, say, Bank of America, Chase, or Wells Fargo is paying you interest commensurate with today’s higher market rates. Not so! Their rates remain mired at pandemic-era lows, ranging from 0.01% to 0.25%. A depositor with a $50,000 balance at these large banks is leaving about $200 per month on the table. Their CD rates are higher, but still uncompetitive.
A simple solution for getting your fair share is a U.S. Treasury money market fund, an indirect way of owning short-term Treasury bills that offers the same daily access to your money as a bank account. Fidelity and Vanguard are two of the largest money fund providers. Adding to the appeal of Treasury money funds, income from some of these funds is mostly exempt from state income tax, an important consideration for Californians.
Another option is an online savings account such as Ally and Synchrony Banks. Keep in mind, however, that online bank accounts do not provide the same state tax benefits as treasury money funds and usually carry somewhat lower yields.
Don’t go overboard
In Greek mythology, the sirens were creatures whose sweet voices lured sailors to destruction. Today they sing to investors, “Five percent return, government guaranteed!” It sounds enticing, especially after the stock and bond market volatility we’ve experienced over the past three to four years. Some pundits go so far as to recommend big portfolio reallocations in favor of cash. Not so fast, I say.
Remember, the 5% that’s advertised today is only promised for the short duration of the T-bill (or CD). The rate available to you when the T-bill matures in a few months is unknown and could easily be much lower than today’s rate. In fact, markets are predicting just such an outcome.
By all means, make sure your cash is getting the best rate possible. But that’s different from moving funds from longer-term investments, such as stocks and bonds, to cash. Historically, such market timing has been an extraordinarily costly practice.
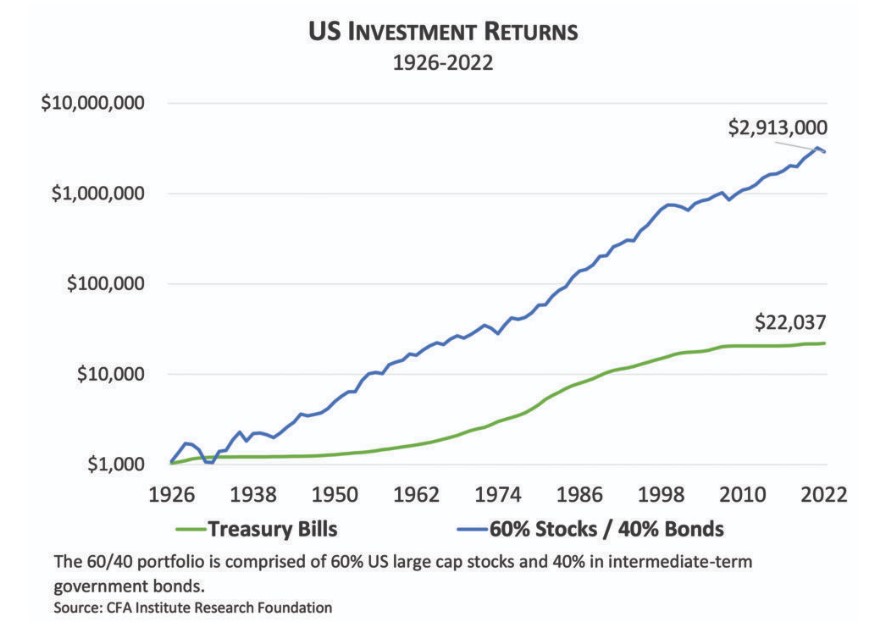
Long-term investors have been handsomely rewarded for taking on the increased volatility of stocks and bonds. The extra return as compared to cash is astounding. To illustrate, $1,000 invested in 1926 in a constant 60% stocks, 40% bonds portfolio grew to more than $2,900,000 by the end of 2022. The same $1,000 invested in T-bills grew to only about $22,000, barely keeping ahead of inflation. The balanced stock/bond portfolio beat cash by a factor of 132! Such is the magic of long-term compounding.
In theory, one could have done even better (with a perfect crystal ball) by jumping to cash just before each market downturn and switching back to stocks and bonds right after they’ve bottomed out. Perhaps not surprisingly, no one in the history of investing has been able to do this consistently. What are the odds that that you or your advisor will be the first?
In fact, studies of retail investor behavior suggest that many people do just the opposite, plunging into the stock market after big runups and selling out after fearful declines. Frequent switching also can result in substantial tax liability.
Today’s higher short-term interest rates are indeed a refreshing change for savers, but don’t let their siren song lure you into altering well considered long-term investment strategies.
Don Gould is president and chief investment officer of Gould Asset Management of Claremont.
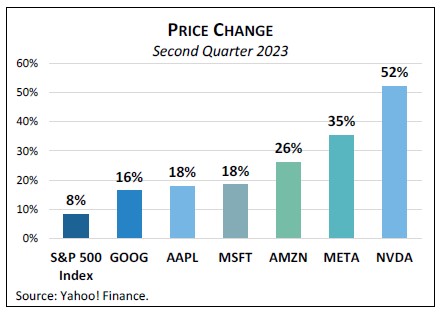
US stock indexes zoomed in the second quarter, with the S&P 500 large cap price index up 8.3%. By early June, the index entered bull market territory, having climbed 20% from its October 2022 low. Stocks were powered higher by a small number of the largest companies, most notably Apple, Microsoft, Nvidia, Amazon, Meta (Facebook), and Alphabet (Google)—call them the Big 6. On June 30, Apple became the first company to surpass a $3 trillion market capitalization (the total value of the company stock).1 Microsoft is not far behind at $2.5 trillion.
Only five years ago, we marveled at Apple hitting the $1 trillion mark and wondered how any single company could be so valuable. Together, Apple and Microsoft account for nearly 15% of the total value of the S&P 500. Most of the Big 6, especially Nvidia, rode a wave of enthusiasm on rapid advances in the artificial intelligence (AI) world. Nvidia makes chips that support AI processing; its stock vaulted 189% in just the first six months of 2023, bringing its market capitalization to over $1 trillion.
The accompanying chart shows the price change of the index compared to the change for each of the Big 6. As these mega-cap stocks dramatically outpaced the index return, it will come as no surprise that the rest of the S&P 500 substantially underperformed the index itself. Therein lies a lesson we repeat often. Most of the performance in any broad index is concentrated in the performance of a small handful of stocks. We never know in advance which stocks those will be, which is why owning the whole index is the only way to make sure you have exposure to the few super-stocks that drive the index’s return.
Systemic Risks Recede
We entered the quarter facing two potential financial emergencies. First was the crisis among larger regional banks, triggered by bank runs and ultimately the failures of Silicon Valley Bank and First Republic Bank. Fortunately, worries in this sector have subsided, although one underlying problem remains—a poorly designed federal deposit insurance program. A similar crisis could await us somewhere down the road.
The second concern related to the need to raise the US national debt ceiling. Absent legislation, by sometime in June the federal government would not have been able to borrow, resulting in an inability to pay all its bills. We were pleased to see Washington reach agreement in late May, a bullet dodged at least a few days before financial markets might have wobbled. On cue, the US stock market surged through the end of the quarter.
A Confounding Economy
The US economy is a study in contradictions. Despite the highest short-term interest rates since 2006, the economy continues to grow at a good clip, keeping the labor market tight and inflation elevated. The Fed raised its federal funds rate in May (to a 5.00%-5.25% range) and then took a pause in June. But while inflation is down more than half from its 9.1% peak reached a year ago, at 3%-4% it remains above the Fed’s 2% long-term target, so most expect the Fed to raise rates at least once more in coming months.
By a common measure, the US Treasury yield curve has been inverted for a full year (short-term interest rates above long-term). This often portends recession, but none is yet in sight. To be sure, sectors sensitive to interest rates, like real estate, are feeling the bite of the Fed’s rate hikes. So far, however, the impact has not been sufficiently widespread to push the overall economy into recession.
Surprisingly persistent economic strength pushed bond yields higher last quarter, causing a small decline in bond prices. Still, bonds are modestly ahead year-to-date, performance vastly better than last year’s bond market debacle. The strong June jobs reports pushed yields higher still in early July, though they also hinted at some deceleration in growth, news the Fed would welcome.
Note: This post is an excerpt from Gould Asset Management’s Economic and Market Review for the Second Quarter of 2023. The excerpt is posted here for the benefit of our blog subscribers.
Stocks Move Higher in Q2 Amid a Resilient Economy and a Red-Hot Tech Sector
Stocks climbed for the third straight quarter despite a variety of challenges, including high interest rates, ongoing geopolitical turmoil, high (but declining) inflation, a regional banking crisis, and a US debt ceiling showdown. Developed markets performed best, led by strong returns in the technology sector.
US large cap stocks, as measured by the S&P 500 stock index, rose 8.7% in the second quarter and are up 16.9% for the year-to-date through June. This puts the S&P 500 officially in bull market territory, up more than 20% from its October 2022 low. A small number of very large cap tech stocks led the charge, as investors cheered advances in artificial intelligence (AI).
Technology (up 15.4%) led all sectors for the second straight quarter and has risen 40.4% year-to-date. The consumer discretionary sector wasn’t far behind, rising 13.9% in Q2 and 32.3% year-to-date. These were the two worst performing sectors in 2022, illustrating how quickly market sentiment can change and why investors should be wary of chasing short-term performance.
Mid and small cap US stocks continued to lag large caps in 2023, with the Wilshire 4500 stock index returning 6.6% in Q2 and 12.8% year-to-date. Technology makes up a smaller component of mid and small cap stocks, which explains some underperformance. Higher borrowing costs and tighter lending standards are additional headwinds.
International developed and emerging market stocks also rose in Q2, but gains were more subdued, with the MSCI EAFE index rising 3.2% (up 12.1% year-to-date) and the MSCI Emerging Markets index gaining 1.0% (up 5.1% year-to-date). Most emerging market regions finished higher in the quarter, but overall performance was restrained by slowing momentum in China’s economic recovery.
Despite the US debt ceiling showdown in May, market volatility was subdued in the quarter, with the VIX volatility index dropping from about 18 to 13 at quarter-end, a level not seen since before the pandemic.
A still from "It's a Wonderful Life." Image/courtesy of Republic Pictures
In the 1946 film classic, “It’s a Wonderful Life,” community banker George Bailey (played by Jimmy Stewart) is besieged by depositors demanding their money after the despised Mr. Potter spurs a run on the bank for his own gain. George says to the anxious crowd, “No, but you … you … you’re thinking of this place all wrong! As if I had the money back in a safe. The money’s not here.” True that.
The past eight weeks have seen a series of Jimmy Stewart moments. First, Silvergate Bank of La Jolla wound itself down on March 8 after massive withdrawals triggered by cryptocurrency woes. Later that week, Silicon Valley Bank was seized by the FDIC after its depositors — mostly businesses funded by venture capital — withdrew tens of billions of dollars in a single day. New York-based Signature Bank quickly followed. And this past weekend, San Francisco’s venerable First Republic Bank was seized and sold after suffering a $100 billion deposit exodus.
Technology abets bank runs
Unlike 1946, today depositors can tweet (and terrify) one another in seconds, and can withdraw billions with mouse clicks. There’s no George Bailey to plead for cooler heads to prevail. When Silicon Valley Bank announced a stock sale to shore up its capital, a bank run ensued the next day. With 98% of its deposits uninsured, SVB’s needing capital was reason enough to move cash to a safer harbor.
Why all these bank failures now? Observers will rightly point to poor decisions by bank management, weak oversight by bank regulators, and the recent spike in interest rates. But in fact, the seeds of this bank contagion were planted with a government policy put in place way back in 2011. Absent the policy, these failed banks might still be in business. Instead, only the timing of the turmoil was in question.
The FDIC and unintended consequences
Through the FDIC, the U.S. government guarantees the first $250,000 for each depositor in each bank, should a bank fail. Deposits exceeding the limit (currently $7 trillion in total) are not insured.
After the great financial crisis of 2008-09, when even the largest banks teetered, in 2011 the U.S. designated eight giant banks (Chase, Bank of America, etc.) as “systemically important,” meaning they are too big to fail. Their deposits are effectively fully insured, regardless of amount. The ugly corollary is that America’s 4,000+ non-systemically important banks are not too big to fail, putting each at some risk of a Jimmy Stewart moment.
Midsized regional banks whose stock is publicly traded are most at risk. That’s because of the self-reinforcing relationship between the stock price and depositor behavior. A few unkind whispers about a bank can cause its stock price to dive, in turn causing depositors to flee. Where there’s smoke, there’s fire, right? The rumors quickly morph into a headline — Bank run underway.
A bank run, especially at a non-systemically important bank, feeds on itself because no one wants to be left holding uninsured deposits, knowing that the bank’s assets likely won’t cover what’s owed. Compounding the problem, regulators are maddeningly vague about whether they will bail out uninsured depositors. Case in point: Silicon Valley Bank was designated a systemically important bank, saving uninsured depositors, but only after regulators shut it down.
Fixing a broken system
To avoid these periodic spasms of bank failures, the government needs to change the rules on deposit insurance. Here are two ideas:
The FDIC could prohibit non-systemically important banks from accepting uninsured deposits. While preventing bank runs, this policy would also tilt the playing field even more in favor of the big systemically important banks and possibly stunt midsize bank lending to smaller businesses.
Or, the FDIC could insure all bank deposits, regardless of size. The argument against this is “moral hazard” — that people will then deposit money into banks without regard to how responsibly the bank uses those funds. (The 1980s savings and loan crisis is the textbook example of this.) Countering this are the plain facts of the recent bank failures — even supposedly sophisticated depositors knew next to nothing about their bank’s condition. After baseball, moral hazard is the national pastime.
Protecting your cash in the meantime
If you or your business are fortunate enough to have more than $250,000 in cash, make sure you are not over the FDIC limit in any one bank. Avoid the systemically important banks — they pay pitifully low interest rates. Instead, spread money across multiple banks and stay under the FDIC limit per bank. There are even programs (Flourish Cash, MaxMyInterest, etc.) that do this for you instantly, with each program bank paying competitive interest rates. Or you can simply buy a U.S. Treasury money market fund and get a better yield still.
In the end, Bailey Bros. Building & Loan survived. It was a simpler time.
Don Gould is president and chief investment officer of Gould Asset Management.