There was never a dull moment for financial markets in the first quarter of 2023. Markets seesawed monthly between optimism and pessimism. The Fed hiked interest rates twice, with another expected. Two banks collapsed amid old fashioned bank runs. The US debt ceiling was reached, with no solution in sight. Here we’ll provide perspective on the factors behind these headlines and the implications for your portfolio.
Pandemic Origins
In a real sense, it all begins with the pandemic—its aftereffects run throughout the recent economic and market turmoil.
Recall that when the pandemic began three years ago, Washington passed huge spending bills to try to prevent the economy from sinking into too deep a hole. The Federal Reserve financed this stimulus through massive money printing to the tune of $5 trillion. Initially, the money surged into financial and other markets, causing a nearly two-year boom in stocks, real estate, and other assets.
As life began returning to normal later in 2021, consumers accelerated their spending on goods and services, making up for lost time. Inflation promptly ensued, with prices rising at their quickest pace in four decades. In response, the Fed has sharply raised interest rates over the past year, pushing up short-term rates from near zero to almost 5%.
After putting the pedal to the floor in 2020 and 2021, the Fed slammed on the brakes in 2022. An economy accustomed to near-zero interest rates for years on end is understandably experiencing shock at the dramatic reversal of policy.
This Year’s Aftershocks
The Fed’s tough medicine has caused cracks in the financial structure, some of which came into plain view in the first quarter of 2023. Most notable was the failure of two banks in early March. The first, Silvergate Bank of La Jolla, California, was briefly viewed as an isolated incident—a bank highly dependent on business from cryptocurrency companies that were reeling from the collapse of crypto broker FTX last November. But as Silvergate’s depositors fled en masse, attention quickly turned to other banks that might suffer a similar run.
Next in the crosshairs was Silicon Valley Bank (SVB). After a mostly illustrious 40-year history, SVB fell stunningly in just 24 hours. The collapse seems obvious in hindsight. Companies funded with venture capital were major beneficiaries of the government’s money fountain of 2020 and 2021. Many of these companies poured deposits into SVB, nearly quadrupling the bank’s total deposits in just three years, from about $50 billion at the end of 2018 to nearly $200 billion in 2021. Deposits exceeding the FDIC’s $250,000 per depositor insurance limit made up well over 95% of SVB’s total deposits.
Unable to generate loans nearly as fast as deposits were piling up, SVB plunged into long-term bonds at the Fed-induced very low interest rates of 2020-21. Rising interest rates in 2022 savaged the value of those bonds, as well as mortgages and other loans carrying fixed interest rates well below today’s rates. Remember, rising rates push down the price of existing bonds (as well as loans) to keep their yields competitive with new, higher rate bonds. The risk: a sudden withdrawal of deposits would force the liquidation of bonds and loans at sharp mark-downs. Taken to its extreme, SVB would not have enough to pay off all depositors. Combine this with a large and concentrated base of mostly uninsured deposits, and fears of a bank run quickly became a self-fulfilling prophecy.
Banking disruption quickly spread abroad, as 163-year-old banking giant Credit Suisse was forced into a fire sale acquisition by rival Union Bank of Switzerland on March 19.
Regulators Waffle
US bank regulators did not have a good month of March, and not only because of the clearly inadequate supervision of SVB in the period leading up to its failure.
Rewind to 2011 when, in the wake of the 2008-09 Great Financial Crisis, regulators deemed eight large US banks “systemically important” (SI), meaning that these SI banks were “too big to fail” and thus all their deposits would be federally insured. In that moment, the regulators implicitly said that the other 4,000+ US banks were not too big to fail, meaning depositors holding uninsured balances there would surely flee at the first sign of trouble. Twelve years later, this unintended consequence came home to roost.
The FDIC compounded the risk of contagion—bank runs spreading across the industry—in its clumsy shutdown of Silicon Valley Bank. After the FDIC seized SVB on Friday, March 10, it announced it would pay off insured deposits Monday morning, but uninsured deposits (those exceeding $250,000 per depositor, i.e., nearly all SVB’s deposits) would be paid with an IOU, one that almost certainly would not be worth its face value, given SVB’s huge portfolio losses. If uninsured depositors at other banks weren’t already worried, the FDIC had just posted a flashing red exit sign.
Realizing its predicament, and prodded by Treasury Secretary Janet Yellen, two days later federal regulators took the extreme (and inevitable) step of declaring SVB systemically important (ironic, as SVB had already failed), thereby insuring all SVB deposits and hopefully heading off other bank runs.
Non-SI banks and their larger depositors remain in a sort of limbo, hoping that the Treasury will wave its magic SI wand for these banks, should push come to shove. The Treasury has been maddeningly vague on this point, and the result has been a $500+ billion exodus of deposits from non-SI banks into SI banks, Treasury bills, and money market funds (which these days mostly invest in Treasury bills). Non-SI banks will experience a significant profit squeeze as a result, which in turn will exact a toll on small and midsize companies. These businesses rely heavily on community and regional banks for loans, and they also account for an outsized share of US job creation.
Debt Ceiling Impasse Looms
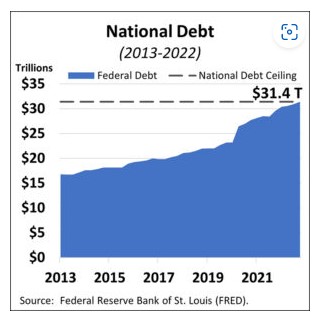
On January 19, the US national debt reached the $31.4 trillion limit imposed by current law. The debt grows over time because the US government almost always spends more than it collects in taxes each year, so it must borrow additional funds each year to cover the shortfall. Since January, unable to add to the debt, the US Treasury has used various accounting tricks to continue to pay bills without breaching the limit, but this buys only so much time. Sometime this summer, either Congress and the President will agree to raise the ceiling, or the government will start missing some payments.
Getting agreement on anything is a challenge in Washington today. However, compromise was reached even in past fractious times, albeit often at the last minute. For example, in 2011 the US came perilously close to some form of default before ultimately raising the ceiling. In response, leading ratings agency Standard & Poor’s downgraded US debt from AAA to AA+, where it remains today.
The question is whether today’s highly polarized political climate will prevent a timely agreement.
The economic and political costs of a US default would be large, growing rapidly until resolved. Consequently, we expect the ceiling will be reached, but probably not before the last minute or even a bit after. Be prepared for a crescendo of fearful statements, accompanied by market volatility. If it happens, remember that your investment time horizon is much longer than the relatively brief period of upheaval. We will watch the situation closely and communicate with you as needed. Of course, we’re always here for any questions.
Note: This post is an excerpt from Gould Asset Management’s Economic and Market Review for the First Quarter of 2023. The excerpt is posted here for the benefit of our blog subscribers.
US Growth Intact but Risks Remain
The US economy grew at a 2.6% annualized rate in the fourth quarter. First quarter consumer spending picked up, but higher interest rates (to fight still high inflation) and a slowing manufacturing sector are headwinds as we enter the second quarter of 2023.
The labor market remains robust as employers continued to add jobs and more people entered the workforce. Unemployment dropped to 3.5% in March and labor force participation ticked up to 62.6%. Additionally, wage pressure appears to be easing with year over year wage gains slowing to 4.2% in March.
Consumer spending increased at its fastest pace in nearly two years in January, followed by moderate growth in February. First quarter activity so far points to a healthy consumer segment after sluggish spending in the fourth quarter.
Fed Hikes Rates Despite Banking Turmoil
The Federal Reserve raised the federal funds rate by 0.25% twice in the first quarter despite elevated stress in the regional banking sector. Fed Chair Powell reiterated the Fed’s commitment to restoring price stability and asserted the banking sector is sound and resilient.
Fed Chair Powell also acknowledged the recent banking turmoil will likely tighten credit conditions for businesses and households, meaning there could be less of a need to raise interest rates going forward.
Updated Fed projections show the federal funds rate topping out at 5.1% by year end, implying one more 0.25% rate hike. GDP growth for 2023 is expected to expand 0.4%, little changed from the previous projection.
Many thanks to those who joined us Thursday, March 23rd, 2023 for Don Gould's live webinar which provided an in-depth update on the current market environment and some of the ongoing challenges facing investors .
Don touched upon quite a few topics which included:
Thanks again to all those who attended. If you have ideas for future topics we should cover or ways we can continue to improve the experience for upcoming broadcasts, please feel free to contact us at contact@gouldasset.com.
For weeks, the news media has been warning of an impending crisis if the two houses of Congress and the president are unable to reach agreement on raising the debt ceiling. Let’s look at what’s going on here and whether you should be losing sleep.
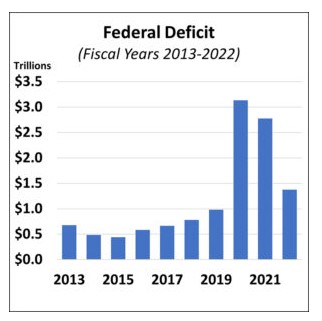
In this century, the United States has run a budget surplus exactly once, in 2001. More typically, we run an annual deficit, meaning the federal government spends more than it collects in taxes. During the pandemic years of 2020 and 2021, the deficit averaged nearly $3 trillion per year due to massive government stimulus, before dropping to $1.4 trillion last year. The government borrows to cover these annual shortfalls, issuing U.S. Treasury securities (bonds, notes, and bills) that range in maturity from just a few weeks to as long as 30 years.
The national debt represents the cumulative effect of annual deficits, the total of the government’s outstanding borrowings. Existing law limits the national debt to the so-called “ceiling.” Once that ceiling is reached, the U.S. government cannot borrow more until the ceiling is raised through legislation. So, as we continue to run deficits, we must periodically raise the ceiling so that the government can continue to meet its obligations, like health care, Social Security, education, social welfare programs, defense, and many other budget items.
On January 19 the U.S. reached its current debt ceiling of $31.4 trillion. Since that time, the treasury, which pays the government’s bills, has used various accounting tricks to continue to meet the government’s obligations without technically breaching the ceiling. But that bag of tricks will be empty sometime this summer, when either a debt ceiling increase will be passed or the government will no longer be able to pay all its bills.
The challenge is ultimately political. Any faction that can block passage of a debt ceiling increase can make legislative demands in return for its agreement to support passage. Think of it as a game of political chicken: no one wants a default, and no one wants to blink.
It’s safe to say that any U.S. government failure to pay its bills would be hugely disruptive. Just the threat of such an outcome in 2011 led to major volatility in financial markets and the once unimaginable downgrade of the U.S. Treasury’s credit rating. We can’t say exactly what will happen if the government fails to pay its employees, contractors, recipients of social welfare programs, and/or the interest and principal on U.S. Treasury securities. But we do know it would be ugly.
For that reason, the general view is that a U.S. default is too “unthinkable” to happen. After all political points have been scored with target voters, surely the ceiling will be raised. The fear, however, is that with increasing political polarization in recent years, the fight over the debt ceiling could escalate beyond what either side wants. Unthinkable does not mean impossible.
I see three possible outcomes; first and perhaps least likely, Washington surprises us and reaches agreement well ahead of the summer deadline, and everyone breathes a sigh of relief. Second, and most likely, the warring factions hold tight past the 11th hour, sending financial markets and the media into a tizzy for at least a couple days, before finally reaching agreement. Third, the stalemate persists beyond the deadline, the government starts missing some payments, and markets and commerce experience serious disruption.
Should the unthinkable third scenario come to pass, the political pressure on all sides for quick resolution would be immense and probably irresistible, leading to a quick resolution, but not before causing substantial collective trauma and a major hit to America’s reputation.
Whatever course this takes, a year from today the debt ceiling clash should be well behind us. With that in mind, my advice is this: prepare yourself mentally for a crescendo of dire warnings over the next few months, and possibly even a real-life panic should we find ourselves in a period of default. But most important, at moments of stress remember that this too shall pass, and probably quickly.
In the meantime, don’t make any rash financial moves because someone says the sky is falling. Soon enough, the sky will be back in its usual spot overhead and the national debt will again be setting new records.
Don Gould is president and chief investment officer of Gould Asset Management.
Stock and bond markets bounced back in the fourth quarter. Global stock benchmarks climbed about 10%, while the leading US bond index gained about 2%. The recovery was largely fueled by a modest decline in bond yields; more on that below. Unfortunately, the fourth quarter’s upturn was not nearly enough to rescue one of the most challenging investing years in memory.
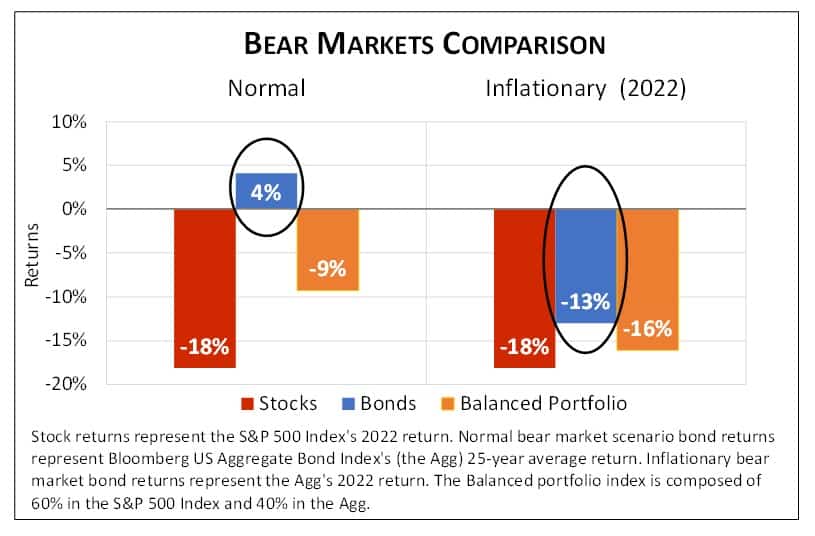
How challenging? It was only the third time in the last 96 years that both stocks and bonds were down in the same calendar year, the previous two being 1931 and 1969. A benchmark of 60% US large cap stocks and 40% US bonds turned in its fourth worst year ever (down about 16%), eclipsed only by two years in the Great Depression and 2008, year of the Great Financial Crisis.
In most bear markets, the bond portion of a balanced portfolio substantially reduces portfolio risk. 2022, however, witnessed the rare inflationary bear market. The accompanying chart illustrates how such an environment can wreak havoc on the balanced portfolio.
The Bond Markets Most Dismal Year
While the roughly 18% decline in both US large cap and global equity indexes was painful, it was well within the range one expects in a bear market, and nothing close to 2008’s 37% decline in the S&P 500. Bonds were the real outlier last year and the main reason balanced portfolios fared so poorly. The leading US bond index dropped 13% last year—it was by a wide margin the worst year ever recorded for this asset class. Understanding bonds’ poor 2022 performance requires a look at both the components of bond returns and the larger macroeconomic backdrop.
A bond’s total return in any period is simply its interest payments plus any change in its price. Recall that the price of an existing bond moves inversely to changes in market interest rates. When rates rise, the price must drop to keep the existing bond’s expected return (its “yield to maturity”) equal to that of the new higher interest rate bonds.
Bond returns suffered on two counts last year. First, rates were very low to begin the year, still reflecting early pandemic policy. The 10-year US Treasury yield began the year at 1.52%. This meant that the interest component of bond returns was small and provided little cushion against the large bond price declines that ensued as interest rates soared last year. Fed actions in 2022 pushed up interest rates on bonds of all maturities, seeking to slow the economy and thereby put a damper on inflationary pressures. The 10-year US Treasury yield closed the year at 3.88%, a rise that translated into a nearly 18% drop in the bond’s price, which swamped the small amount of interest earned.
Last Year's Bad News is Hopefully This Year's Better News
While it is impossible to predict this (or any) year’s stock market return, we do think bonds are much more likely to provide portfolio protection in 2023. Taking the US 10-year Treasury again as an example, we know with near certainty that the bondholder will earn nearly 4% in interest over the course of the year. Should rates continue to climb, that 4% is a much bigger cushion against bond price declines than was available a year ago. Also, with a recession potentially in the offing and inflation showing signs of moderating, we think that any further increase in interest rates (and associated bond price declines) will likely be muted when compared to 2022.
If we’re right, then at a minimum, bonds will dilute equity market risk in 2023. And there’s a reasonable chance that bond returns will swing back into the black this year, meaning they could add to the balanced portfolio’s return.
On the equities side of the coin, the stock market had nearly everything going against it in 2022. It started with a market where many of the highest fliers had already begun their descent as much as a year earlier, in early 2021. As we noted here a year ago, a steadily shrinking list of the largest cap stocks led the market to its all-time high at the end of 2021. This declining “breadth” often portends trouble. The Fed’s monetary tightening pushed up interest rates, helping bonds compete with stocks for the first time in ages. Higher rates have also had their intended effect of slowing the economy and raising the odds of recession (and lower corporate earnings) in 2023, further weighing down stocks last year. The market also lost its manic aspect last year as the air was let out of many of the most speculative corners of the investment world, such as Tesla stock and cryptocurrencies. Finally, Russia’s invasion of Ukraine last February started a war that continues to hamper the global economy today. Potential good news for stock markets could be that in a recession, equities tend to turn upward well before the economy bottoms. Most observers expect any recession to run its course in 2023, in which case a sustained upturn in stock markets could begin sometime this year.
An Aerial View of the Turbulent Pandemic Years
It is both easy and natural to remember most clearly whatever has happened most recently, whether that’s politics, markets, our personal lives, or something else. Cognitive psychologists call this “recency bias.” For investors, 2022’s very challenging markets are likely top of mind. Part of our job as advisors is to help our clients keep the longer-term picture in view when looking both forward and back.
This mindset is particularly helpful in considering the last three years, a period dominated by the world’s first pandemic in a century. An aerial view of pandemic-era macroeconomic policy might be summarized as follows. Fearing a massive slowdown, the government slashed interest rates to near zero while also pumping trillions of dollars of fiscal stimulus into the economy. As the pandemic faded and the economy rebounded, inflation quickly took hold when labor markets and output could not keep up with soaring demand. In response, central banks slammed on the brakes, pushing up interest rates.
Investors endured a three year roller coaster ride with both the economy and financial markets. But in the end, after all the dust has settled, it’s remarkable to see that by economic and financial measures, the period as a whole was, well, average. Despite all the wild swings, the S&P 500 annual return for 2020-2022 was about 7.7%, not much below its long-term average. Similarly, as the accompanying chart shows, GDP ended the three-year period almost exactly on its long-term trend line—all this despite fears of both depression and runaway inflation within the period.
The moral of the story remains the same. Keeping our eye on long-term goals, consistent with our long-term time horizon, is the surest way to avoid overreaction in the moment.
Note: This post is an excerpt from Gould Asset Management’s Economic and Market Review for the Fourth Quarter of 2022. The excerpt is posted here for the benefit of our blog subscribers.
Stocks Pare Losses in Q4, Capping Rocky Year for Markets
US stocks rallied in the fourth quarter amid signs of moderating inflation and hope that the Federal Reserve’s pace of rate hikes might soon slow. US large cap stocks (the S&P 500 index) rose 7.6% in Q4 but it was not nearly enough to make up for earlier losses in 2022, a year that saw high inflation, sharply rising interest rates, and war in Ukraine. Accordingly, US large caps declined 18.1% in 2022, the fourth worst year for US stocks since the 1940s.
The Industrial and Materials sectors performed best in the fourth quarter, rising 19.2% and 15.1% respectively in Q4, while Utilities stocks took the top prize for the year, rising 1.6% in 2022. Aside from the Energy sector (see discussion in our alternatives section), Utilities were the only sector to post a positive return in 2022, illustrating what a challenging year it was for US stocks. The Consumer Discretionary and Technology sectors were particularly hard hit, falling 36.2% and 27.6% on the year.
Mid and small cap US stocks (the Wilshire 4500 index) did even worse than large caps, rising 5.3% in Q4 but still falling 23.9% for the full year. Markets believe slowing economic growth or outright recession will disproportionately impact mid and small cap companies.
After a rough first three quarters of the year, international stocks rebounded strongly in Q4, with the MSCI EAFE index jumping 17.4%, as the US dollar weakened and inflation pressures
abated. For the year, international developed stocks fell 14.0%—outperforming US stocks in a calendar year for the first time since 2017. Emerging markets stocks also had a strong quarter, with the MSCI Emerging Markets index rising 9.8%, cutting year-to-date losses to 19.7%. Chinese stocks (down over 20% in 2022) weighed on returns, as they comprise about one-third of emerging market indexes.
Market volatility, as measured by the VIX volatility index, subsided in the fourth quarter, with the index dropping from 31 at the start of October to 21 by year-end as markets rallied. A reading of 21 is close to the long-term average for VIX, suggesting market volatility may be returning to normal after the tumult of 2022.
To paraphrase the old song, mama said there’d be years like this. Notwithstanding such warnings, 2022 has been a jarring time for investors.
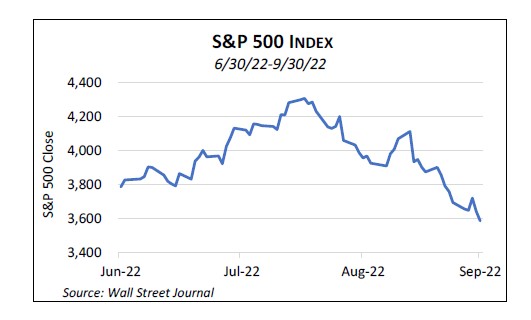
It's a bit of a cliché to say that the stock market took a roller coaster ride, but the third quarter’s chart looks right out of an amusement park. The market chugged mostly upwards from the start of the quarter into mid-August and then abruptly plunged, with the S&P 500 index ending about 5% below where it began the quarter.
Stubbornly high monthly inflation reports made clear that central banks would continue pushing interest rates higher in a bid to dampen price pressures. Interest rates across the yield curve spiked in August and September, directly pushing down bond prices and indirectly pummeling the stock market. Higher interest rates shrink corporate earnings and reduce what stock investors will pay for the earnings that remain, a double whammy.
Nowhere to Hide
In most economic environments, the same factors that cause stocks to fall—economic slowing—also push up the price of high quality bonds. And bonds usually are much less volatile than stocks. Together, these characteristics cushion against stock market declines in portfolios having some balance of stock and bonds. A notable exception is when central banks are fighting inflation with higher interest rates, causing stocks and bonds to fall in tandem. 2022 is just such a year and that’s what has made it so challenging. Year-to-date through the end of the third quarter, the S&P 500 stock index and the Bloomberg Aggregate Bond index are down 24% and 15%, respectively, leaving investors with almost no place to hide. To get some perspective on how unusual 2022 has been, bonds are having their worst performance in 70 years.
Diversification across asset classes usually reduces portfolio risk, but as we’ve seen with stocks and bonds moving in tandem this year, it’s no guarantee. On rare occasions, several baskets of eggs get dropped at once. We note, for example, that some portfolio investments fell at the very end of the quarter due to insurance losses caused by Hurricane Ian. Natural disasters are almost completely uncorrelated with general economic trends, yet this hurricane managed to land itself just inside an already bad quarter for financial markets. Likewise, in the third quarter the UK selected a new prime minister, Liz Truss, after the unscheduled departure of PM Boris Johnson. Truss quickly announced simulative tax cuts in the face of double-digit inflation, sparking an immediate crisis in UK bond and currency markets that rippled around the globe. Meanwhile, the war in Ukraine continues to inflict significant economic damage in western Europe and beyond. When it rains, sometimes it pours.
Silver Linings
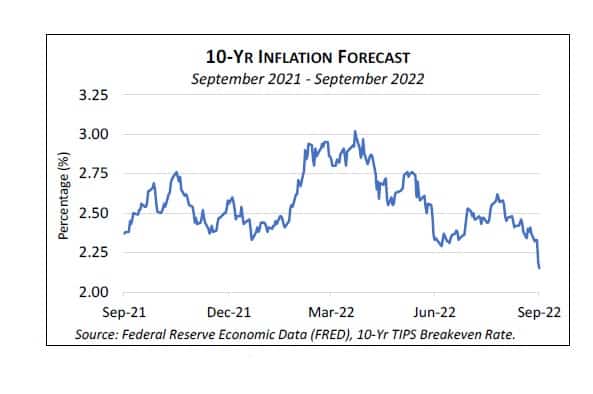
Inflation has been the single largest driver of stock and bond market weakness this year. And while the monthly CPI reports continue to show high levels of inflation over trailing 12-month periods, bond markets now forecast inflation averaging less than 2.5% per year over the next two years. Certainly, bond market forecasts are not infallible—bond investors were mostly caught off guard by the current inflation spike. But the real (inflation-adjusted) returns on investments of literally trillions of dollars are riding on these forecasts, so we take them seriously. Hard as it may be to envision right now, lower inflation may be in the offing.
Another silver lining is today’s higher bond yields. While the recent rise in yields depressed the price of existing bonds, on the flip side, investors will now invest and reinvest (for example, bond interest and principal received at maturity) at much more attractive rates. For most of the past 40 years, declining interest rates juiced current bond returns while shrinking future expected returns. Now we see that process work in reverse.
The US GDP contracted at a 0.6% annualized rate in the second quarter, marking the second consecutive quarter of negative growth. However, an alternative measure of economic activity, gross domestic income (GDI), increased at a 1.4% rate. The two measures tend to converge over time. A recession may be looming but there are signs that segments of the economy remain strong.
The job market remains red hot as the unemployment rate ticked down to 3.5% from 3.7% in September, which will do little to deter the Fed from its rate-hiking campaign.
The ISM manufacturing index fell to 50.9 in September, from 52.8, meaning the sector is still in expansion territory, but activity slowed more than expected. The decline was driven by sharp drops in new orders and job growth. Price pressures and supply bottlenecks appear to be easing though.
Consumer spending, which accounts for about two-thirds of US GDP, rose 0.4% in August. However, wage growth appears to be slowing and consumers are tapping excess savings to offset the effects of stubbornly high inflation.
Mortgage rates rose to their highest levels since 2008 and home prices remain high as affordability deteriorated further this quarter. New home sales increased unexpectedly in August, but existing and pending home sales continued their months-long declines.
Stocks worldwide have declined steadily from their all-time highs reached at the start of 2022. The benchmark S&P 500 US stock index recently exceeded the 20% decline from peak that (arbitrarily) defines a bear market. Adding to investor woes, bonds have not provided their usual portfolio cushion this year. The Bloomberg US Aggregate bond index fell about 10% in the first half of 2022.
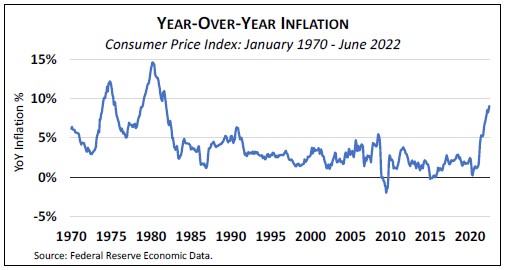
Resurgent inflation Resurgent inflation is the proximate cause of both markets’ swoon this year. After ranging between 0% and 4% for the past 30 years, the Consumer Price Index clocked an 9.1% jump in the year ended June 30. High energy and food prices, exacerbated by the war in Ukraine, are significant contributors, as are consumer catch-up spending and a still tight labor market coming out of the pandemic. The inflation spike triggered a row of market dominoes.
First, the Federal Reserve is aggressively raising short-term interest rates, seeking to tamp down demand and moderate further price hikes. Interest rates on all bond maturities are way above where they began the year. Short-term rates (for example, the three-month US T-bill), which are most directly affected by Fed policy, jumped from a microscopic 0.06% at the beginning of the year to 1.72% on June 30. Meanwhile, the benchmark 10-year Treasury yield nearly doubled from 1.52% at year-end to 2.98%. When market interest rates rise, the price of existing bonds must fall to keep their yields competitive with yields on new bonds.
Second, most see rising odds of economic recession in the next year. Higher interest rates dampen growth across the economy, and spiking prices for staple items like gasoline and groceries leave less in the household budget for other spending.
Finally, recession brings lower corporate earnings, while higher interest rates make bonds more competitive with stocks. These are double body blows for the stock market.
Perils of anchoring Seeing our portfolio values shrink is unpleasant, even if only on paper. It is human nature to mentally anchor our assets to their maximum historical price, whether that’s the highest value your home reached on Zillow or the biggest number shown on a monthly brokerage statement.
It’s easy to think, “If only I’d sold at that high water mark, I’d be better off now.”
Perhaps true, but consider this: we only know a high-water mark with the benefit of hindsight. And it is impossible for everyone to sell (at a high-water mark or any other time) because for every seller there must be a buyer. In other words, selling at a peak assumes you’ve figured out something the rest of the market has not — a tempting line of thinking that’s generally hazardous to your financial wellbeing.
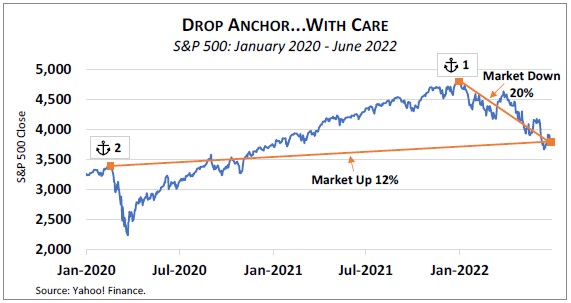
Selling last December (Anchor 1 in the accompanying chart) would have entailed substantial tax liability for most investors, never to be regained. As bad, it would leave you sitting in cash wondering when to get back in. Market bottoms, like tops, are only known with hindsight and often occur when pessimism seems to be running highest. In our experience, investors who bail out amid a bear market rarely reenter at a level below their earlier sale price.
Consolation and perspective One way to combat regret after a market decline is simply to relocate your anchor. For example, if instead of comparing your assets today to their value at year-end 2021, look to February 19, 2020 (Anchor 2 in the chart), at that time also an all-time high for the S&P 500. Since then, the US stock market is up nearly 12%. Considering that the period included a pandemic, a land war in Europe, and unprecedented political turmoil, 12% could be viewed as a surprisingly good outcome.
Many rightly worry that recession is coming soon or perhaps already here. But from a market perspective, that news is already baked into today’s prices and probably explains much of the recent decline. No one has a crystal ball to foretell where the market will go next, but the odds still favor buying (or holding) stocks after significant market declines.
Looking at post-World War II data, following a 20% decline like we’ve had this year, the S&P 500 finished higher at the end of the subsequent 12-month period about 64% of the time — less than the 79% of calendar years that were positive, but still almost two-in-three odds of coming out ahead. Three years out, the market ended higher 90% of the time. (Source: FactSet, Bloomberg, as of 6/16/22.) Consumer sentiment recently reached record lows, thanks to high inflation, but that has often been an indicator of better stock market performance ahead.
Bottom line: in stormy seas, it’s usually best to take a Dramamine and lash yourself to the mast rather than jumping overboard.
Don Gould is president and chief investment officer of Gould Asset Management.
No question about it—it was a very tough quarter for stock and bond markets and everyone who invests in them. The benchmark S&P 500 fell 16.1% in the quarter, bringing its decline from peak to the 20% drop that arbitrarily defines a bear market. In the face of rising interest rates, US bonds fell another 4.7% in the quarter and are now down 10.4% year-to-date, their worst start in over fifty years. The combination of stocks and bonds both tumbling has made 2022 more painful than typical bear markets, where bonds usually provide a better portfolio cushion.
As unpleasant as this year has been, it is not entirely a bolt from the blue. More realistically, it is a natural reaction to the extraordinary times that preceded it. From the early pandemic low in February 2020 through the end of 2021, the S&P 500 index climbed a stunning 113%, or roughly the equivalent of ten years’ worth of average historical returns in 22 months. The combination of pandemic, government stimulus, and lockdowns led to manic levels of risk appetite for everything from blue chips to bitcoin. A sobering up simply required a catalyst, and that turned out to be inflation.
Resurgent Inflation
Resurgent inflation is the proximate cause of both stock and bond markets’ swoon this year. After ranging between 0% and 4% for the past thirty years, the Consumer Price Index clocked a 9.1% jump in the twelve months ended June 30. High energy and food prices, exacerbated by the war in Ukraine, are significant contributors, as are consumer catch-up spending and a still tight labor market coming out of the pandemic. The inflation spike triggered a row of market dominoes.
First, the Federal Reserve is aggressively raising short-term interest rates, seeking to tamp down demand and moderate further price hikes. Interest rates on all bond maturities are way above where they began the year. Short-term rates (for example, the 3-month US T-bill), which are most directly affected by Fed policy, jumped from a microscopic 0.06% at the beginning of the year to 1.72% on June 30.
Meanwhile, the benchmark 10-year Treasury yield nearly doubled from 1.52% at year-end to 2.98%. When market interest rates rise, the price of existing bonds must fall to keep their yields competitive with yields on new bonds.
Second, most see rising odds of economic recession in the next year. Higher interest rates dampen growth across the economy, and spiking prices for staple items like gasoline and groceries leave less in the household budget for other spending.
Finally, recession brings lower corporate earnings, while higher interest rates make bonds more competitive with stocks. These are double body blows for the stock market.
Perils of Anchoring
Seeing our portfolio values shrink is unpleasant, even if only on paper. It is human nature to mentally anchor our assets to their maximum historical price, whether that’s the highest value your home reached on Zillow or the biggest number shown on a monthly brokerage statement. It’s easy to think, “if only I’d sold at that high water mark, I’d be better off now.”
Perhaps true, but consider this: we only know a high water mark with the benefit of hindsight. And it is impossible for everyone to sell (at a high water mark or any other time) because for every seller there must be a buyer. In other words, selling at what you think is a peak assumes you’ve figured out something the rest of the market has not—a tempting line of thinking that’s generally hazardous to your financial well-being.
Selling last December (Anchor 1 in the accompanying chart) would have entailed substantial tax liability for most investors, never to be regained. As bad, it would leave you sitting in cash wondering when to get back in. Market bottoms, like tops, are only known with hindsight; the bottom often is reached when pessimism seems to be running highest. In our experience, investors who bail out amid a bear market rarely re-enter at a level below their earlier sale price.
Consolation and Perspective
One way to combat regret after a market decline is simply to relocate your anchor. For example, if instead of comparing your assets today to their value at year-end 2021, look to February 19, 2020 (Anchor 2 in the chart), at that time also an all-time high for the S&P 500. Since then, the US stock market is up nearly 12%. Considering that the period included a pandemic, a land war in Europe, and unprecedented political turmoil, 12% could be viewed as a surprisingly good outcome.
Many rightly worry that recession is coming soon or perhaps already here. But from a market perspective, that news is already baked into today’s prices and probably explains much of the recent decline. No one has a crystal ball to foretell where the market will go next, but the odds still favor buying (or holding) stocks after significant market declines. Looking at post-World War II data, following a 20% decline like we’ve had this year, the S&P 500 finished higher at the end of the subsequent 12-month period about 64% of the time—less than the 79% of calendar years that were positive, but still almost 2-in-3 odds of coming out ahead. Three years out, the market ended higher 90% of the time.1 Consumer sentiment recently reached record lows, thanks to high inflation, but that has often been an indicator of better stock market performance ahead.
Bottom line: in stormy seas, it’s usually best to take a Dramamine and lash yourself to the mast rather than jumping overboard.